Reader's Question: Next year we will sell our family farm and expect to net in excess of $200,000. Our tax preparer says to pay the tax and invest the rest. Is this correct? If so, where should we invest? My husband and I are both in our 60s and would certainly like more income to help us enjoy this stage of our life.
Since you are selling real estate, you should first determine whether or not your farm qualifies as your principal residence; in accordance with IRS rules, if your farm property is your home, you and your husband might qualify for exclusion of up to $500,000 in profits from your capital gains tax calculation. Here's a Bankrate.com article covering this home-sale tax exemption.
If your farm is not your principal residence, then it will likely be treated as an investment property and you can qualify for a "like-kind" 1031 tax-deferred exchange if you meet the IRS requirements. Again, here's a Bankrate.com article for an overview. You might consider swapping your farm for any of a variety of common types of rental income property (e.g., apartments, small offices, self-storage facilities). Appropriately selected rental properties are capable of offering solid positive cash flow, which can provide the income stream you are seeking. With real estate markets weakening across the country, now seems to be a good time to start looking for properties being offered at attractive prices by motivated sellers.
As your tax preparer suggests, you can alternatively just pay any capital gains tax you might owe upon sale of your farm and roll the after-tax proceeds into other investments of your choice. If you choose to follow this option, I would suggest paying close attention to fees and expenses when reinvesting. Minimizing investment management fees will tend over time to give you higher returns. If you are comfortable choosing individual stocks (including ETFs and REITs, many of which pay substantial dividends) and bonds on your own, you'll save by avoiding having to pay fees to a fund manager. Opening an account at a reputable discount broker can also help reduce transaction costs. If you decide that mutual funds suit your investment style better than buying individual securities directly, I suggest seriously considering only funds with low fees and low portfolio turnover.
In case you have not yet seen it, you might also wish to peruse my earlier comments on wealth generation in a five-part series on long-term investing.

Should we sell the farm and pay the tax?
Reader's Question: Next year we will sell our family farm and expect to net in excess of $200,000. Our tax preparer says to pay the tax and invest the rest. Is this correct? If so, where should we invest? My husband and I are both in our 60s and would certainly like more income to help us enjoy this stage of our life.
Since you are selling real estate, you should first determine whether or not your farm qualifies as your principal residence; in accordance with IRS rules, if your farm property is your home, you and your husband might qualify for exclusion of up to $500,000 in profits from your capital gains tax calculation. Here's a Bankrate.com article covering this home-sale tax exemption.
If your farm is not your principal residence, then it will likely be treated as an investment property and you can qualify for a "like-kind" 1031 tax-deferred exchange if you meet the IRS requirements. Again, here's a Bankrate.com article for an overview. You might consider swapping your farm for any of a variety of common types of rental income property (e.g., apartments, small offices, self-storage facilities). Appropriately selected rental properties are capable of offering solid positive cash flow, which can provide the income stream you are seeking. With real estate markets weakening across the country, now seems to be a good time to start looking for properties being offered at attractive prices by motivated sellers.
As your tax preparer suggests, you can alternatively just pay any capital gains tax you might owe upon sale of your farm and roll the after-tax proceeds into other investments of your choice. If you choose to follow this option, I would suggest paying close attention to fees and expenses when reinvesting. Minimizing investment management fees will tend over time to give you higher returns. If you are comfortable choosing individual stocks (including ETFs and REITs, many of which pay substantial dividends) and bonds on your own, you'll save by avoiding having to pay fees to a fund manager. Opening an account at a reputable discount broker can also help reduce transaction costs. If you decide that mutual funds suit your investment style better than buying individual securities directly, I suggest seriously considering only funds with low fees and low portfolio turnover.
In case you have not yet seen it, you might also wish to peruse my earlier comments on wealth generation in a five-part series on long-term investing.
Since you are selling real estate, you should first determine whether or not your farm qualifies as your principal residence; in accordance with IRS rules, if your farm property is your home, you and your husband might qualify for exclusion of up to $500,000 in profits from your capital gains tax calculation. Here's a Bankrate.com article covering this home-sale tax exemption.
If your farm is not your principal residence, then it will likely be treated as an investment property and you can qualify for a "like-kind" 1031 tax-deferred exchange if you meet the IRS requirements. Again, here's a Bankrate.com article for an overview. You might consider swapping your farm for any of a variety of common types of rental income property (e.g., apartments, small offices, self-storage facilities). Appropriately selected rental properties are capable of offering solid positive cash flow, which can provide the income stream you are seeking. With real estate markets weakening across the country, now seems to be a good time to start looking for properties being offered at attractive prices by motivated sellers.
As your tax preparer suggests, you can alternatively just pay any capital gains tax you might owe upon sale of your farm and roll the after-tax proceeds into other investments of your choice. If you choose to follow this option, I would suggest paying close attention to fees and expenses when reinvesting. Minimizing investment management fees will tend over time to give you higher returns. If you are comfortable choosing individual stocks (including ETFs and REITs, many of which pay substantial dividends) and bonds on your own, you'll save by avoiding having to pay fees to a fund manager. Opening an account at a reputable discount broker can also help reduce transaction costs. If you decide that mutual funds suit your investment style better than buying individual securities directly, I suggest seriously considering only funds with low fees and low portfolio turnover.
In case you have not yet seen it, you might also wish to peruse my earlier comments on wealth generation in a five-part series on long-term investing.
Real Estate and Leverage: How much is best?
Reader's Question: I'm 28 years old. My wife and I both work as electrical engineers in jobs that pay well. Using our savings we have been buying income-producing real estate to replace our employment income and now own 11 units. Is real estate the best vehicle for achieving our goal of becoming financially independent to free up time for activities we consider more meaningful? I have not found other investments that offer such handsome cash yields and permit a similar degree of leverage. Also, regarding leverage, what is the optimal amount of overall leverage for our property portfolio? Is it wise to "lever to the max" with exotic strategies (like wrap notes on properties purchased subject-to), or would we be better off de-leveraging our portfolio so that we don’t need to keep as much cash on hand to cover downside risk associated with leverage? I am struggling with the correct amount of property to purchase given our cash reserves.
In asset allocation and capital structure, the two areas of portfolio management your questions relate to, there are many different investing approaches, each of which has its own merits and unwavering supporters. Rather than try to show in any objective sense that one approach is always superior to the others, I will provide a personal perspective based on my own investing experiences, going broader than your specific inquiry to provide a fuller picture of what has worked for me over the past 25 years. I hope anyone reading this article is able to benefit from what I have to say; however, since even small differences in personal circumstances and preferences can sometimes lead to very different choices and approaches to investing, I encourage you to consider my opinions only as a point of reference, while proceeding to seek out advice from professionals who have the time and expertise to understand your situation thoroughly and work with you more closely to achieve your goals.
Real Estate Investing During the 1980s and 1990s
Since you are targeting a high cash yield and refer to your real estate as "units," I assume that you own apartments (though office buildings, neighborhood retail stores, mixed-use properties, storage facilities, mobile home parks and other real property are also all capable of generating predictable cash flow).
During the early 1980s, I made my first income property investment using a few thousand dollars I had managed to save from my job as a teaching and research assistant while studying for my graduate degree at an East Coast university and living frugally in a shared student house. I invested in apartments in California through a partnership run by an experienced general manager familiar to me through friends and relatives. We were leveraged at about 70% loan-to-value and the property produced good cash flow distributions. With California real estate steadily appreciating, the investment did well throughout the 1980s.
Following graduation in 1985, I took a high-paying job on Wall Street and continued to invest my (now more substantial) savings into other apartment buildings in Southern California. With occupancy above 95%, rents rising at above 5% per year, and limited available land for new development, rental properties continued to appreciate. I recall at the end of 1990 receiving an unsolicited offer for a 16-unit property of ours at a price of $1.15 million (or $72,000 per unit, a very attractive price at that time), which on paper produced a total return-on-equity of 150% in less than three years!
But good times, of course, don't last forever. The U.S. recession beginning in late 1990 hit Southern California hard. Real estate prices softened and buyers evaporated. Realtors and investors caught in the fallout coined the phrase "Stay alive till '95," expressing their confidence that the market would recover by the middle of the decade. Recovery, however, was slower than expected, and significant market strength did not return until around 2000, a full decade following the 1990 peak.
During the market nadir in the mid-1990s, the vacancy rate in one of our buildings rose to 15% and we had to reduce rents by about 10% and offer move-in specials to attract new tenants. In the worst year of operations, cash flow became negative by about 1% of property value (which would have been worse if we had been leveraged more highly).
After what in retrospect was a long roller-coaster ride, partially buffered by not being over-leveraged, we ended up selling the properties, mostly during the market runup from 2000 to 2005. During my total 10- to 15-year holding period, I achieved acceptable but unimpressive, single-digit compounded annnualized returns. This muted, bond-like, long-run performance of an equity investment is largely a reflection of the extended market slump during the mid-1990s, but perhaps the more important outcome from this experience is that we survived and even managed to make a little money during a period when a number of more highly leveraged investors and developers faced foreclosure and bankruptcy.
Lessons from the Last Time Around
With attention to leverage and cash flow, a few observations may be helpful:
Cyclicality: Despite a strong secular tendency to rise indefinitely, real estate markets also exhibit significant cyclical behavior. On a timing clock, with 12 o'clock at the market's top and 6 o'clock at the bottom, I would pair up the following times and dates:
9 o'clock: Market rises in late 1980s
12 o'clock: Market peaks at end of 1990
3 o'clock: Market falls during early 1990s
6 o'clock: Market bottoms around 1995
9 o'clock: Market recovers in late 1990s
Though it may still be too early to judge conclusively, I suspect that we will likely look back at 2005 or 2006 as defining another 12 o'clock real estate market peak.
Leverage and Cash Flow: Leverage slices both ways, producing quick double-digit returns on the way up (as during the middle and late 1980s) and often even quicker negative double-digit returns on the way down (as from 1990 to 1995). As a general principle, I believe it prudent never to leverage a property beyond the zero-cash-flow breakeven point between positive and negative operating cash flow (after debt service and a reserve charge for major repairs, but before depreciation and amortization). A conservative rule of thumb for determining appropriate leverage is to apply a stress test by bumping the economic vacancy rate up to two or three times its normal level (e.g., 5% vacancy becomes 10% to 15% vacancy) and making sure that the property still has either sufficient positive cash flow or adequate cash in the bank to cover this worst-case scenario for a full year of stressed operation.
Total Investment Return: While prudent cash flow management and avoidance of over-leverage (of which a wrap note can be a tell-tale sign) are important for survival during times of protracted rental market weakness, investment returns are often more impacted by property price appreciation than cash flow. Particularly for investment horizons of 10 years or shorter, market timing tends to matter. Admittedly, buy and sell decisions are difficult to get exactly right and each time around is different from the previous times, but I believe that it is possible to cultivate a type of "wisdom" about the markets by observing the macro and local economic forces and their influence on prices over many cycles, thereby developing a slight edge over less diligent players.
Don't Forget About Alternative Markets
Between 2000 and 2005, while I was selling my units in California, I seriously looked for replacement properties in the Washington state area where I now live. My target was a 15% return-on-equity over a pro forma five-year investment horizon, consistent with an 8% cap rate, at 70% loan-to-value, 7% debt service (principal and interest), a 10% cash-on-cash return, and 3% annual property price appreciation, fully accounting for property management fees during the holding period and brokerage fees upon sale. During my property search, I made a handful of offers but was unable to close on a desirable investment property at my price target.
What drove my direct investment target was an investment alternative: indirectly investing in real estate by buying shares of publicly listed REITs. At that time, which was in the wake of the dot-com bubble when office vacancy rates had risen to 20% in high-tech centers, shares of office REITs were trading at depressed price levels consistent with my 8% cap rate and 10% cash-on-cash return target. I viewed office REITs as more attractively priced and having more upside pootential than apartment, retail and other REITs, and proceeded to roll my sales proceeds from the California apartments into shares of Equity Office Properties and Trizec. As good fortune would have it, these two office REITs ended up getting bought out at premium prices in late 2006 and early 2007 by large private-equity buyout funds, providing me with returns that well exceeded my original total return target.
The message here is that, before concluding that direct ownership of income-producing real estate is the best way to meet your investment objectives, I would encourage you to give serious consideration to at least the REIT market and, more generally, the overall stock market. Since the middle of last year, with the subprime crisis feeding recession fears, REITs have taken a fall and are again beginning to look relatively attractive. In my opinion, HRPT Properties (NYSE: HRP), an office REIT with class A and class B properties in both major and more minor cities, is worth considering, since it is now trading at just 65% of book value (equivalent to a "see through" 9% to 10% cap rate with a 14% to 15% cash-on-cash return) and offers an 11% dividend which looks stable. This or other REITs or other dividend-paying stocks may also provide you with the sense of financial independence you are seeking through direct ownership of real estate.
Although I currently own no real estate other than my own residence, I expect again to buy investment properties when an attractive opportunity presents itself. My guess is that the U.S. real estate market as a whole is now at about 3 o'clock on the timing model mentioned above, and could have another year or two to go before reaching the 6 o'clock bottom. The Seattle market where I am is still performing stronger than most other markets, which leads me to believe that I could have even a longer wait if I keep my local focus. On the other hand, I'm sure that there must be a few markets in other states (including your area?) where great deals may be found even this year.
When a Job Can Be More Than Just a Job
Your desire to generate investment income to give you financial freedom to pursue other activities you believe will be more fulfilling than continuing to work at your job as an engineer is a common goal of many people in our 21st-century society dominated by large corporations driven by efficiency and profit objectives. For better or worse, within a few years on the job, most of us Americans come to view our occupations primarily in financial terms, i.e., exchange of our labor for money, while disregarding less tangible benefits such as constructive participation in an endeavor for the good of society, contributing to the smooth operation of our economy, making widgets that we all need and use, helping others by applying our individual talents, etc.
Given the focus of so many Americans on becoming financially independent and retiring early, I was surprised recently to run across an interesting statistic indicating the extent to which America has become less aristocratic over the past century. In 1929, 70% of the income of the top 0.01% (or 1 out of 10,000) earners came from investment income derived from ownership of income-producing assets such as real estate, stock and bonds. By contrast, in 1998, again among the top 0.01% of earners, just 20% of income came from income-producing assets, while the remaining 80% came from wages and entrepreneurial income. (From Piketty and Saez, "Income Inequality in the United States, 1913-1998," as cited in Rajan and Zingales, Saving Capitalism from the Capitalists, 2003, p. 92)
I find it intriguing and even inspiring that the bulk of the income of top earners comes from business endeavors that these top earners are actively involved in as wage earners and entrepreneurs. What this indicates is that today in America, even moreso than a few generations ago, tremendous opportunities exist for anyone clever enough, bright enough and enterprising enough to apply their talents constructively to provide products and services in high demand. In other words, we should view our labor not just as a simple exchange of our time for money but also, at a higher level, as a contribution to the advancement and betterment of society with potential for phenomenally high compensation for the highest achievers. I'm not sure how you are planning to spend your time if or when you do one day leave your current job, but here's a suggestion: how about aspiring to rise to the level of those one-in-ten-thousand hardworking wage earners and entrepreneurs who are making a difference in our world? Generous financial and personal rewards are apparently available for those who succeed.
Certainly, investing to achieve self-sustaining personal lifetime income is a worthy goal to have. But, let's not stop there. Anyone focussed and fortunate enough to get that far should, I feel, both for one's personal satisfaction and for the good of society, actively proceed to find ways to share one's expertise and continue contributing to improving the lives of everyone.
In asset allocation and capital structure, the two areas of portfolio management your questions relate to, there are many different investing approaches, each of which has its own merits and unwavering supporters. Rather than try to show in any objective sense that one approach is always superior to the others, I will provide a personal perspective based on my own investing experiences, going broader than your specific inquiry to provide a fuller picture of what has worked for me over the past 25 years. I hope anyone reading this article is able to benefit from what I have to say; however, since even small differences in personal circumstances and preferences can sometimes lead to very different choices and approaches to investing, I encourage you to consider my opinions only as a point of reference, while proceeding to seek out advice from professionals who have the time and expertise to understand your situation thoroughly and work with you more closely to achieve your goals.
Real Estate Investing During the 1980s and 1990s
Since you are targeting a high cash yield and refer to your real estate as "units," I assume that you own apartments (though office buildings, neighborhood retail stores, mixed-use properties, storage facilities, mobile home parks and other real property are also all capable of generating predictable cash flow).
During the early 1980s, I made my first income property investment using a few thousand dollars I had managed to save from my job as a teaching and research assistant while studying for my graduate degree at an East Coast university and living frugally in a shared student house. I invested in apartments in California through a partnership run by an experienced general manager familiar to me through friends and relatives. We were leveraged at about 70% loan-to-value and the property produced good cash flow distributions. With California real estate steadily appreciating, the investment did well throughout the 1980s.
Following graduation in 1985, I took a high-paying job on Wall Street and continued to invest my (now more substantial) savings into other apartment buildings in Southern California. With occupancy above 95%, rents rising at above 5% per year, and limited available land for new development, rental properties continued to appreciate. I recall at the end of 1990 receiving an unsolicited offer for a 16-unit property of ours at a price of $1.15 million (or $72,000 per unit, a very attractive price at that time), which on paper produced a total return-on-equity of 150% in less than three years!
But good times, of course, don't last forever. The U.S. recession beginning in late 1990 hit Southern California hard. Real estate prices softened and buyers evaporated. Realtors and investors caught in the fallout coined the phrase "Stay alive till '95," expressing their confidence that the market would recover by the middle of the decade. Recovery, however, was slower than expected, and significant market strength did not return until around 2000, a full decade following the 1990 peak.
During the market nadir in the mid-1990s, the vacancy rate in one of our buildings rose to 15% and we had to reduce rents by about 10% and offer move-in specials to attract new tenants. In the worst year of operations, cash flow became negative by about 1% of property value (which would have been worse if we had been leveraged more highly).
After what in retrospect was a long roller-coaster ride, partially buffered by not being over-leveraged, we ended up selling the properties, mostly during the market runup from 2000 to 2005. During my total 10- to 15-year holding period, I achieved acceptable but unimpressive, single-digit compounded annnualized returns. This muted, bond-like, long-run performance of an equity investment is largely a reflection of the extended market slump during the mid-1990s, but perhaps the more important outcome from this experience is that we survived and even managed to make a little money during a period when a number of more highly leveraged investors and developers faced foreclosure and bankruptcy.
Lessons from the Last Time Around
With attention to leverage and cash flow, a few observations may be helpful:
Cyclicality: Despite a strong secular tendency to rise indefinitely, real estate markets also exhibit significant cyclical behavior. On a timing clock, with 12 o'clock at the market's top and 6 o'clock at the bottom, I would pair up the following times and dates:
9 o'clock: Market rises in late 1980s
12 o'clock: Market peaks at end of 1990
3 o'clock: Market falls during early 1990s
6 o'clock: Market bottoms around 1995
9 o'clock: Market recovers in late 1990s
Though it may still be too early to judge conclusively, I suspect that we will likely look back at 2005 or 2006 as defining another 12 o'clock real estate market peak.
Leverage and Cash Flow: Leverage slices both ways, producing quick double-digit returns on the way up (as during the middle and late 1980s) and often even quicker negative double-digit returns on the way down (as from 1990 to 1995). As a general principle, I believe it prudent never to leverage a property beyond the zero-cash-flow breakeven point between positive and negative operating cash flow (after debt service and a reserve charge for major repairs, but before depreciation and amortization). A conservative rule of thumb for determining appropriate leverage is to apply a stress test by bumping the economic vacancy rate up to two or three times its normal level (e.g., 5% vacancy becomes 10% to 15% vacancy) and making sure that the property still has either sufficient positive cash flow or adequate cash in the bank to cover this worst-case scenario for a full year of stressed operation.
Total Investment Return: While prudent cash flow management and avoidance of over-leverage (of which a wrap note can be a tell-tale sign) are important for survival during times of protracted rental market weakness, investment returns are often more impacted by property price appreciation than cash flow. Particularly for investment horizons of 10 years or shorter, market timing tends to matter. Admittedly, buy and sell decisions are difficult to get exactly right and each time around is different from the previous times, but I believe that it is possible to cultivate a type of "wisdom" about the markets by observing the macro and local economic forces and their influence on prices over many cycles, thereby developing a slight edge over less diligent players.
Don't Forget About Alternative Markets
Between 2000 and 2005, while I was selling my units in California, I seriously looked for replacement properties in the Washington state area where I now live. My target was a 15% return-on-equity over a pro forma five-year investment horizon, consistent with an 8% cap rate, at 70% loan-to-value, 7% debt service (principal and interest), a 10% cash-on-cash return, and 3% annual property price appreciation, fully accounting for property management fees during the holding period and brokerage fees upon sale. During my property search, I made a handful of offers but was unable to close on a desirable investment property at my price target.
What drove my direct investment target was an investment alternative: indirectly investing in real estate by buying shares of publicly listed REITs. At that time, which was in the wake of the dot-com bubble when office vacancy rates had risen to 20% in high-tech centers, shares of office REITs were trading at depressed price levels consistent with my 8% cap rate and 10% cash-on-cash return target. I viewed office REITs as more attractively priced and having more upside pootential than apartment, retail and other REITs, and proceeded to roll my sales proceeds from the California apartments into shares of Equity Office Properties and Trizec. As good fortune would have it, these two office REITs ended up getting bought out at premium prices in late 2006 and early 2007 by large private-equity buyout funds, providing me with returns that well exceeded my original total return target.
The message here is that, before concluding that direct ownership of income-producing real estate is the best way to meet your investment objectives, I would encourage you to give serious consideration to at least the REIT market and, more generally, the overall stock market. Since the middle of last year, with the subprime crisis feeding recession fears, REITs have taken a fall and are again beginning to look relatively attractive. In my opinion, HRPT Properties (NYSE: HRP), an office REIT with class A and class B properties in both major and more minor cities, is worth considering, since it is now trading at just 65% of book value (equivalent to a "see through" 9% to 10% cap rate with a 14% to 15% cash-on-cash return) and offers an 11% dividend which looks stable. This or other REITs or other dividend-paying stocks may also provide you with the sense of financial independence you are seeking through direct ownership of real estate.
Although I currently own no real estate other than my own residence, I expect again to buy investment properties when an attractive opportunity presents itself. My guess is that the U.S. real estate market as a whole is now at about 3 o'clock on the timing model mentioned above, and could have another year or two to go before reaching the 6 o'clock bottom. The Seattle market where I am is still performing stronger than most other markets, which leads me to believe that I could have even a longer wait if I keep my local focus. On the other hand, I'm sure that there must be a few markets in other states (including your area?) where great deals may be found even this year.
When a Job Can Be More Than Just a Job
Your desire to generate investment income to give you financial freedom to pursue other activities you believe will be more fulfilling than continuing to work at your job as an engineer is a common goal of many people in our 21st-century society dominated by large corporations driven by efficiency and profit objectives. For better or worse, within a few years on the job, most of us Americans come to view our occupations primarily in financial terms, i.e., exchange of our labor for money, while disregarding less tangible benefits such as constructive participation in an endeavor for the good of society, contributing to the smooth operation of our economy, making widgets that we all need and use, helping others by applying our individual talents, etc.
Given the focus of so many Americans on becoming financially independent and retiring early, I was surprised recently to run across an interesting statistic indicating the extent to which America has become less aristocratic over the past century. In 1929, 70% of the income of the top 0.01% (or 1 out of 10,000) earners came from investment income derived from ownership of income-producing assets such as real estate, stock and bonds. By contrast, in 1998, again among the top 0.01% of earners, just 20% of income came from income-producing assets, while the remaining 80% came from wages and entrepreneurial income. (From Piketty and Saez, "Income Inequality in the United States, 1913-1998," as cited in Rajan and Zingales, Saving Capitalism from the Capitalists, 2003, p. 92)
I find it intriguing and even inspiring that the bulk of the income of top earners comes from business endeavors that these top earners are actively involved in as wage earners and entrepreneurs. What this indicates is that today in America, even moreso than a few generations ago, tremendous opportunities exist for anyone clever enough, bright enough and enterprising enough to apply their talents constructively to provide products and services in high demand. In other words, we should view our labor not just as a simple exchange of our time for money but also, at a higher level, as a contribution to the advancement and betterment of society with potential for phenomenally high compensation for the highest achievers. I'm not sure how you are planning to spend your time if or when you do one day leave your current job, but here's a suggestion: how about aspiring to rise to the level of those one-in-ten-thousand hardworking wage earners and entrepreneurs who are making a difference in our world? Generous financial and personal rewards are apparently available for those who succeed.
Certainly, investing to achieve self-sustaining personal lifetime income is a worthy goal to have. But, let's not stop there. Anyone focussed and fortunate enough to get that far should, I feel, both for one's personal satisfaction and for the good of society, actively proceed to find ways to share one's expertise and continue contributing to improving the lives of everyone.
Real Estate and Leverage: How much is best?
Reader's Question: I'm 28 years old. My wife and I both work as electrical engineers in jobs that pay well. Using our savings we have been buying income-producing real estate to replace our employment income and now own 11 units. Is real estate the best vehicle for achieving our goal of becoming financially independent to free up time for activities we consider more meaningful? I have not found other investments that offer such handsome cash yields and permit a similar degree of leverage. Also, regarding leverage, what is the optimal amount of overall leverage for our property portfolio? Is it wise to "lever to the max" with exotic strategies (like wrap notes on properties purchased subject-to), or would we be better off de-leveraging our portfolio so that we don’t need to keep as much cash on hand to cover downside risk associated with leverage? I am struggling with the correct amount of property to purchase given our cash reserves.
In asset allocation and capital structure, the two areas of portfolio management your questions relate to, there are many different investing approaches, each of which has its own merits and unwavering supporters. Rather than try to show in any objective sense that one approach is always superior to the others, I will provide a personal perspective based on my own investing experiences, going broader than your specific inquiry to provide a fuller picture of what has worked for me over the past 25 years. I hope anyone reading this article is able to benefit from what I have to say; however, since even small differences in personal circumstances and preferences can sometimes lead to very different choices and approaches to investing, I encourage you to consider my opinions only as a point of reference, while proceeding to seek out advice from professionals who have the time and expertise to understand your situation thoroughly and work with you more closely to achieve your goals.
Real Estate Investing During the 1980s and 1990s
Since you are targeting a high cash yield and refer to your real estate as "units," I assume that you own apartments (though office buildings, neighborhood retail stores, mixed-use properties, storage facilities, mobile home parks and other real property are also all capable of generating predictable cash flow).
During the early 1980s, I made my first income property investment using a few thousand dollars I had managed to save from my job as a teaching and research assistant while studying for my graduate degree at an East Coast university and living frugally in a shared student house. I invested in apartments in California through a partnership run by an experienced general manager familiar to me through friends and relatives. We were leveraged at about 70% loan-to-value and the property produced good cash flow distributions. With California real estate steadily appreciating, the investment did well throughout the 1980s.
Following graduation in 1985, I took a high-paying job on Wall Street and continued to invest my (now more substantial) savings into other apartment buildings in Southern California. With occupancy above 95%, rents rising at above 5% per year, and limited available land for new development, rental properties continued to appreciate. I recall at the end of 1990 receiving an unsolicited offer for a 16-unit property of ours at a price of $1.15 million (or $72,000 per unit, a very attractive price at that time), which on paper produced a total return-on-equity of 150% in less than three years!
But good times, of course, don't last forever. The U.S. recession beginning in late 1990 hit Southern California hard. Real estate prices softened and buyers evaporated. Realtors and investors caught in the fallout coined the phrase "Stay alive till '95," expressing their confidence that the market would recover by the middle of the decade. Recovery, however, was slower than expected, and significant market strength did not return until around 2000, a full decade following the 1990 peak.
During the market nadir in the mid-1990s, the vacancy rate in one of our buildings rose to 15% and we had to reduce rents by about 10% and offer move-in specials to attract new tenants. In the worst year of operations, cash flow became negative by about 1% of property value (which would have been worse if we had been leveraged more highly).
After what in retrospect was a long roller-coaster ride, partially buffered by not being over-leveraged, we ended up selling the properties, mostly during the market runup from 2000 to 2005. During my total 10- to 15-year holding period, I achieved acceptable but unimpressive, single-digit compounded annnualized returns. This muted, bond-like, long-run performance of an equity investment is largely a reflection of the extended market slump during the mid-1990s, but perhaps the more important outcome from this experience is that we survived and even managed to make a little money during a period when a number of more highly leveraged investors and developers faced foreclosure and bankruptcy.
Lessons from the Last Time Around
With attention to leverage and cash flow, a few observations may be helpful:
Cyclicality: Despite a strong secular tendency to rise indefinitely, real estate markets also exhibit significant cyclical behavior. On a timing clock, with 12 o'clock at the market's top and 6 o'clock at the bottom, I would pair up the following times and dates:
9 o'clock: Market rises in late 1980s
12 o'clock: Market peaks at end of 1990
3 o'clock: Market falls during early 1990s
6 o'clock: Market bottoms around 1995
9 o'clock: Market recovers in late 1990s
Though it may still be too early to judge conclusively, I suspect that we will likely look back at 2005 or 2006 as defining another 12 o'clock real estate market peak.
Leverage and Cash Flow: Leverage slices both ways, producing quick double-digit returns on the way up (as during the middle and late 1980s) and often even quicker negative double-digit returns on the way down (as from 1990 to 1995). As a general principle, I believe it prudent never to leverage a property beyond the zero-cash-flow breakeven point between positive and negative operating cash flow (after debt service and a reserve charge for major repairs, but before depreciation and amortization). A conservative rule of thumb for determining appropriate leverage is to apply a stress test by bumping the economic vacancy rate up to two or three times its normal level (e.g., 5% vacancy becomes 10% to 15% vacancy) and making sure that the property still has either sufficient positive cash flow or adequate cash in the bank to cover this worst-case scenario for a full year of stressed operation.
Total Investment Return: While prudent cash flow management and avoidance of over-leverage (of which a wrap note can be a tell-tale sign) are important for survival during times of protracted rental market weakness, investment returns are often more impacted by property price appreciation than cash flow. Particularly for investment horizons of 10 years or shorter, market timing tends to matter. Admittedly, buy and sell decisions are difficult to get exactly right and each time around is different from the previous times, but I believe that it is possible to cultivate a type of "wisdom" about the markets by observing the macro and local economic forces and their influence on prices over many cycles, thereby developing a slight edge over less diligent players.
Don't Forget About Alternative Markets
Between 2000 and 2005, while I was selling my units in California, I seriously looked for replacement properties in the Washington state area where I now live. My target was a 15% return-on-equity over a pro forma five-year investment horizon, consistent with an 8% cap rate, at 70% loan-to-value, 7% debt service (principal and interest), a 10% cash-on-cash return, and 3% annual property price appreciation, fully accounting for property management fees during the holding period and brokerage fees upon sale. During my property search, I made a handful of offers but was unable to close on a desirable investment property at my price target.
What drove my direct investment target was an investment alternative: indirectly investing in real estate by buying shares of publicly listed REITs. At that time, which was in the wake of the dot-com bubble when office vacancy rates had risen to 20% in high-tech centers, shares of office REITs were trading at depressed price levels consistent with my 8% cap rate and 10% cash-on-cash return target. I viewed office REITs as more attractively priced and having more upside pootential than apartment, retail and other REITs, and proceeded to roll my sales proceeds from the California apartments into shares of Equity Office Properties and Trizec. As good fortune would have it, these two office REITs ended up getting bought out at premium prices in late 2006 and early 2007 by large private-equity buyout funds, providing me with returns that well exceeded my original total return target.
The message here is that, before concluding that direct ownership of income-producing real estate is the best way to meet your investment objectives, I would encourage you to give serious consideration to at least the REIT market and, more generally, the overall stock market. Since the middle of last year, with the subprime crisis feeding recession fears, REITs have taken a fall and are again beginning to look relatively attractive. In my opinion, HRPT Properties (NYSE: HRP), an office REIT with class A and class B properties in both major and more minor cities, is worth considering, since it is now trading at just 65% of book value (equivalent to a "see through" 9% to 10% cap rate with a 14% to 15% cash-on-cash return) and offers an 11% dividend which looks stable. This or other REITs or other dividend-paying stocks may also provide you with the sense of financial independence you are seeking through direct ownership of real estate.
Although I currently own no real estate other than my own residence, I expect again to buy investment properties when an attractive opportunity presents itself. My guess is that the U.S. real estate market as a whole is now at about 3 o'clock on the timing model mentioned above, and could have another year or two to go before reaching the 6 o'clock bottom. The Seattle market where I am is still performing stronger than most other markets, which leads me to believe that I could have even a longer wait if I keep my local focus. On the other hand, I'm sure that there must be a few markets in other states (including your area?) where great deals may be found even this year.
When a Job Can Be More Than Just a Job
Your desire to generate investment income to give you financial freedom to pursue other activities you believe will be more fulfilling than continuing to work at your job as an engineer is a common goal of many people in our 21st-century society dominated by large corporations driven by efficiency and profit objectives. For better or worse, within a few years on the job, most of us Americans come to view our occupations primarily in financial terms, i.e., exchange of our labor for money, while disregarding less tangible benefits such as constructive participation in an endeavor for the good of society, contributing to the smooth operation of our economy, making widgets that we all need and use, helping others by applying our individual talents, etc.
Given the focus of so many Americans on becoming financially independent and retiring early, I was surprised recently to run across an interesting statistic indicating the extent to which America has become less aristocratic over the past century. In 1929, 70% of the income of the top 0.01% (or 1 out of 10,000) earners came from investment income derived from ownership of income-producing assets such as real estate, stock and bonds. By contrast, in 1998, again among the top 0.01% of earners, just 20% of income came from income-producing assets, while the remaining 80% came from wages and entrepreneurial income. (From Piketty and Saez, "Income Inequality in the United States, 1913-1998," as cited in Rajan and Zingales, Saving Capitalism from the Capitalists, 2003, p. 92)
I find it intriguing and even inspiring that the bulk of the income of top earners comes from business endeavors that these top earners are actively involved in as wage earners and entrepreneurs. What this indicates is that today in America, even moreso than a few generations ago, tremendous opportunities exist for anyone clever enough, bright enough and enterprising enough to apply their talents constructively to provide products and services in high demand. In other words, we should view our labor not just as a simple exchange of our time for money but also, at a higher level, as a contribution to the advancement and betterment of society with potential for phenomenally high compensation for the highest achievers. I'm not sure how you are planning to spend your time if or when you do one day leave your current job, but here's a suggestion: how about aspiring to rise to the level of those one-in-ten-thousand hardworking wage earners and entrepreneurs who are making a difference in our world? Generous financial and personal rewards are apparently available for those who succeed.
Certainly, investing to achieve self-sustaining personal lifetime income is a worthy goal to have. But, let's not stop there. Anyone focussed and fortunate enough to get that far should, I feel, both for one's personal satisfaction and for the good of society, actively proceed to find ways to share one's expertise and continue contributing to improving the lives of everyone.
In asset allocation and capital structure, the two areas of portfolio management your questions relate to, there are many different investing approaches, each of which has its own merits and unwavering supporters. Rather than try to show in any objective sense that one approach is always superior to the others, I will provide a personal perspective based on my own investing experiences, going broader than your specific inquiry to provide a fuller picture of what has worked for me over the past 25 years. I hope anyone reading this article is able to benefit from what I have to say; however, since even small differences in personal circumstances and preferences can sometimes lead to very different choices and approaches to investing, I encourage you to consider my opinions only as a point of reference, while proceeding to seek out advice from professionals who have the time and expertise to understand your situation thoroughly and work with you more closely to achieve your goals.
Real Estate Investing During the 1980s and 1990s
Since you are targeting a high cash yield and refer to your real estate as "units," I assume that you own apartments (though office buildings, neighborhood retail stores, mixed-use properties, storage facilities, mobile home parks and other real property are also all capable of generating predictable cash flow).
During the early 1980s, I made my first income property investment using a few thousand dollars I had managed to save from my job as a teaching and research assistant while studying for my graduate degree at an East Coast university and living frugally in a shared student house. I invested in apartments in California through a partnership run by an experienced general manager familiar to me through friends and relatives. We were leveraged at about 70% loan-to-value and the property produced good cash flow distributions. With California real estate steadily appreciating, the investment did well throughout the 1980s.
Following graduation in 1985, I took a high-paying job on Wall Street and continued to invest my (now more substantial) savings into other apartment buildings in Southern California. With occupancy above 95%, rents rising at above 5% per year, and limited available land for new development, rental properties continued to appreciate. I recall at the end of 1990 receiving an unsolicited offer for a 16-unit property of ours at a price of $1.15 million (or $72,000 per unit, a very attractive price at that time), which on paper produced a total return-on-equity of 150% in less than three years!
But good times, of course, don't last forever. The U.S. recession beginning in late 1990 hit Southern California hard. Real estate prices softened and buyers evaporated. Realtors and investors caught in the fallout coined the phrase "Stay alive till '95," expressing their confidence that the market would recover by the middle of the decade. Recovery, however, was slower than expected, and significant market strength did not return until around 2000, a full decade following the 1990 peak.
During the market nadir in the mid-1990s, the vacancy rate in one of our buildings rose to 15% and we had to reduce rents by about 10% and offer move-in specials to attract new tenants. In the worst year of operations, cash flow became negative by about 1% of property value (which would have been worse if we had been leveraged more highly).
After what in retrospect was a long roller-coaster ride, partially buffered by not being over-leveraged, we ended up selling the properties, mostly during the market runup from 2000 to 2005. During my total 10- to 15-year holding period, I achieved acceptable but unimpressive, single-digit compounded annnualized returns. This muted, bond-like, long-run performance of an equity investment is largely a reflection of the extended market slump during the mid-1990s, but perhaps the more important outcome from this experience is that we survived and even managed to make a little money during a period when a number of more highly leveraged investors and developers faced foreclosure and bankruptcy.
Lessons from the Last Time Around
With attention to leverage and cash flow, a few observations may be helpful:
Cyclicality: Despite a strong secular tendency to rise indefinitely, real estate markets also exhibit significant cyclical behavior. On a timing clock, with 12 o'clock at the market's top and 6 o'clock at the bottom, I would pair up the following times and dates:
9 o'clock: Market rises in late 1980s
12 o'clock: Market peaks at end of 1990
3 o'clock: Market falls during early 1990s
6 o'clock: Market bottoms around 1995
9 o'clock: Market recovers in late 1990s
Though it may still be too early to judge conclusively, I suspect that we will likely look back at 2005 or 2006 as defining another 12 o'clock real estate market peak.
Leverage and Cash Flow: Leverage slices both ways, producing quick double-digit returns on the way up (as during the middle and late 1980s) and often even quicker negative double-digit returns on the way down (as from 1990 to 1995). As a general principle, I believe it prudent never to leverage a property beyond the zero-cash-flow breakeven point between positive and negative operating cash flow (after debt service and a reserve charge for major repairs, but before depreciation and amortization). A conservative rule of thumb for determining appropriate leverage is to apply a stress test by bumping the economic vacancy rate up to two or three times its normal level (e.g., 5% vacancy becomes 10% to 15% vacancy) and making sure that the property still has either sufficient positive cash flow or adequate cash in the bank to cover this worst-case scenario for a full year of stressed operation.
Total Investment Return: While prudent cash flow management and avoidance of over-leverage (of which a wrap note can be a tell-tale sign) are important for survival during times of protracted rental market weakness, investment returns are often more impacted by property price appreciation than cash flow. Particularly for investment horizons of 10 years or shorter, market timing tends to matter. Admittedly, buy and sell decisions are difficult to get exactly right and each time around is different from the previous times, but I believe that it is possible to cultivate a type of "wisdom" about the markets by observing the macro and local economic forces and their influence on prices over many cycles, thereby developing a slight edge over less diligent players.
Don't Forget About Alternative Markets
Between 2000 and 2005, while I was selling my units in California, I seriously looked for replacement properties in the Washington state area where I now live. My target was a 15% return-on-equity over a pro forma five-year investment horizon, consistent with an 8% cap rate, at 70% loan-to-value, 7% debt service (principal and interest), a 10% cash-on-cash return, and 3% annual property price appreciation, fully accounting for property management fees during the holding period and brokerage fees upon sale. During my property search, I made a handful of offers but was unable to close on a desirable investment property at my price target.
What drove my direct investment target was an investment alternative: indirectly investing in real estate by buying shares of publicly listed REITs. At that time, which was in the wake of the dot-com bubble when office vacancy rates had risen to 20% in high-tech centers, shares of office REITs were trading at depressed price levels consistent with my 8% cap rate and 10% cash-on-cash return target. I viewed office REITs as more attractively priced and having more upside pootential than apartment, retail and other REITs, and proceeded to roll my sales proceeds from the California apartments into shares of Equity Office Properties and Trizec. As good fortune would have it, these two office REITs ended up getting bought out at premium prices in late 2006 and early 2007 by large private-equity buyout funds, providing me with returns that well exceeded my original total return target.
The message here is that, before concluding that direct ownership of income-producing real estate is the best way to meet your investment objectives, I would encourage you to give serious consideration to at least the REIT market and, more generally, the overall stock market. Since the middle of last year, with the subprime crisis feeding recession fears, REITs have taken a fall and are again beginning to look relatively attractive. In my opinion, HRPT Properties (NYSE: HRP), an office REIT with class A and class B properties in both major and more minor cities, is worth considering, since it is now trading at just 65% of book value (equivalent to a "see through" 9% to 10% cap rate with a 14% to 15% cash-on-cash return) and offers an 11% dividend which looks stable. This or other REITs or other dividend-paying stocks may also provide you with the sense of financial independence you are seeking through direct ownership of real estate.
Although I currently own no real estate other than my own residence, I expect again to buy investment properties when an attractive opportunity presents itself. My guess is that the U.S. real estate market as a whole is now at about 3 o'clock on the timing model mentioned above, and could have another year or two to go before reaching the 6 o'clock bottom. The Seattle market where I am is still performing stronger than most other markets, which leads me to believe that I could have even a longer wait if I keep my local focus. On the other hand, I'm sure that there must be a few markets in other states (including your area?) where great deals may be found even this year.
When a Job Can Be More Than Just a Job
Your desire to generate investment income to give you financial freedom to pursue other activities you believe will be more fulfilling than continuing to work at your job as an engineer is a common goal of many people in our 21st-century society dominated by large corporations driven by efficiency and profit objectives. For better or worse, within a few years on the job, most of us Americans come to view our occupations primarily in financial terms, i.e., exchange of our labor for money, while disregarding less tangible benefits such as constructive participation in an endeavor for the good of society, contributing to the smooth operation of our economy, making widgets that we all need and use, helping others by applying our individual talents, etc.
Given the focus of so many Americans on becoming financially independent and retiring early, I was surprised recently to run across an interesting statistic indicating the extent to which America has become less aristocratic over the past century. In 1929, 70% of the income of the top 0.01% (or 1 out of 10,000) earners came from investment income derived from ownership of income-producing assets such as real estate, stock and bonds. By contrast, in 1998, again among the top 0.01% of earners, just 20% of income came from income-producing assets, while the remaining 80% came from wages and entrepreneurial income. (From Piketty and Saez, "Income Inequality in the United States, 1913-1998," as cited in Rajan and Zingales, Saving Capitalism from the Capitalists, 2003, p. 92)
I find it intriguing and even inspiring that the bulk of the income of top earners comes from business endeavors that these top earners are actively involved in as wage earners and entrepreneurs. What this indicates is that today in America, even moreso than a few generations ago, tremendous opportunities exist for anyone clever enough, bright enough and enterprising enough to apply their talents constructively to provide products and services in high demand. In other words, we should view our labor not just as a simple exchange of our time for money but also, at a higher level, as a contribution to the advancement and betterment of society with potential for phenomenally high compensation for the highest achievers. I'm not sure how you are planning to spend your time if or when you do one day leave your current job, but here's a suggestion: how about aspiring to rise to the level of those one-in-ten-thousand hardworking wage earners and entrepreneurs who are making a difference in our world? Generous financial and personal rewards are apparently available for those who succeed.
Certainly, investing to achieve self-sustaining personal lifetime income is a worthy goal to have. But, let's not stop there. Anyone focussed and fortunate enough to get that far should, I feel, both for one's personal satisfaction and for the good of society, actively proceed to find ways to share one's expertise and continue contributing to improving the lives of everyone.
Population Growth Trends of Countries and Global Investing Strategy
“Demographics is destiny,” is a phrase that is way overused and abused. Demographics isn’t necessarily destiny, but it does play a major role in the rise and fall of civilizations. For example Rome the city at its height of power had over a million residents and controlled 100 million subjects. When Rome fell to the Germanic raiders it had only 50,000 residents left and its control did not extend much outside the city. Demographics is important, which in turn may influence where you choose to invest. So we thought it would be interesting to see how the populations represented by some of the international ETFs we follow stack up against the U.S. in terms of demographics.
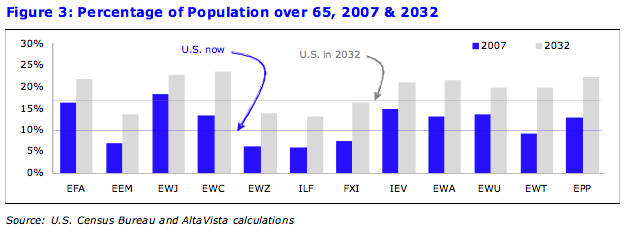
Using estimates from the U.S. Census Bureau, we calculated the expected population growth over the next 25 years—roughly a generation—as well as the percentage of the population 65 years of age or older, both now and in 2032. For single country ETFs this was easy; for the regional funds we used a weighted average of the constituent countries.
What we found was in some cases surprising. The biggest surprise was that the market with the fastest overall population growth between now and 2032 is not in the emerging markets but rather it is the United States, which is expected to grow 23% from 301 million now to 357 million in the next quarter century.
The population represented by the MSCI Emerging Market index (EEM) is expected to grow 18% over the same period, dragged down by double-digit population declines South Africa (about 8% of EEM assets) and Russia (8%), as well as virtual stagnation in Korea, which is about 14% of the index. This is partially offset by a population explosion in India, but Indian companies are only about 6% of index assets. Meanwhile the one-child policy for urban couples in China (FXI)—adopted in an era of scarcity when few were thinking about having the manpower necessary to sustain growth—has resulted in a relatively slow-growing population, along with a host of other unintended consequences (too many baby boys).
Japan is facing substantial population declines over the coming quarter century and the country also drags down the overall population growth of countries in the MSCI EAFE index (EFA) of developed-markets, since Japanese companies account for nearly 21%. The U.K. (EWU) is preferential to continental Europe, where population declines in Germany, Spain, Italy and Finland are expected to decrease the overall population growth rates for the S&P Europe 350 (IEV), even though U.K. companies represent almost a third of that index.
click to enlarge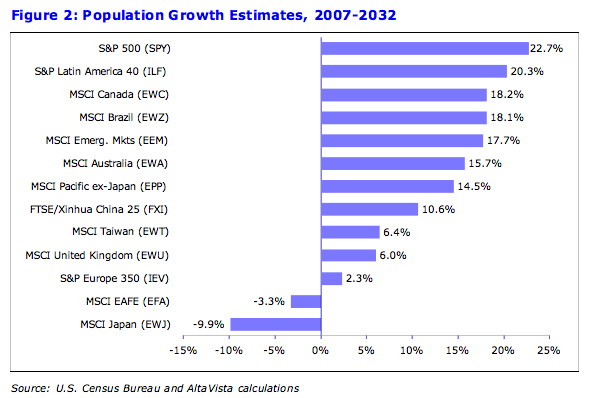
Figure 3 illustrates that a graying population is something which all markets have in common. Japan has the largest percentage of people over 65, with European economies (EFA and IEV) not far behind. And Japan’s “elderly burden” will get worse, although Canada (EWC) is likely to eclipse Japan as the country with the biggest imbalance by 2032.
The U.S. (SPY) has the youngest average population of any developed market, and is expected to keep that designation in the future, but Latin America (ILF) and Brazil (EWZ) take the overall prize for the youngest populations, both now and in 2032.
China may be the first country in history to grow old before it gets rich: by 2032 its elderly burden will be nearly as high as it is in the U.S., but the country won’t have nearly the same resources on a per capita basis to deal with the challenges (then again, its government has not made the same promises).
What does all this mean? Unfortunately it isn’t likely to generate any short-term trading ideas, but it does provide some perspective for a thematic approach to international investing:
- The U.S. is relatively well-off compared with other developed markets. It will be better able to grow its way out of its problems, and its companies could see faster earnings growth, which in turn would justify the slight premium U.S. companies get over European firms (Japanese companies are still more expensive).
- China-hype may be misplaced. China is older than the other emerging markets overall, and is likely to see much slower population growth as well. Twenty-five years from now India will have the world’s largest population, about 100 million ahead of China—and they’ll be much younger too.
- The question of whether Japan is emerging from a roughly 15-year economic slump is academic; in the long run—there is no diplomatic way to say this—the country is dying. Global winners like Toyota (TM) are relatively immune and may thrive regardless, but the fortunes of most of companies in EWJ are undeniably linked to the vanishing Japanese consumer.
- Canada is getting older quickly but it may not matter. Exploitation of the oil sands could turn the country into a nation of wealthy pensioners. Similarly, Australia is getting much older, but will exhibit decent overall population growth and is rich in natural resources that could have a bigger impact than demographics.
To be sure, there are shortcomings in this analysis. First, estimates could be wrong. Societies can undergo significant changes in a quarter century that could alter birth rates, death rates, and immigration, and as a result, demographics. And as alluded to in reference to Toyota, in our global economy it probably makes less difference where a company is headquartered today than it did a generation ago.
But perhaps the biggest shortcoming is the extremely long-term nature of the analysis itself. Because while we pride ourselves on being long-term investors, demographics isn’t destiny, and as the famous economist John Maynard Keynes said, “In the long run, we’re all dead.”
Six Winners with Oil at $100
As oil flirts with $100, there are certain sectors that will benefit while others cringe at the thought of a triple-digit price per barrel.Some of the winners may be obvious while a few are secondary, less popular ideas.
Winners
- Suncor Energy (SU) is a Canadian oil and gas company that was the first to produce commercial crude oil from the Canadian oil sands. The company is currently producing 284,000 barrels per day of oil equivalent. What I like about SU is the exposure to the oil sands and the proximity to the US. With oil at $100 the government will be pressured to lessen our dependence on oil from the Middle East. With Canada to our north, why not increase the amount of oil derived from the oil sands?
- FMC Technologies (FTI) supplies subsea drilling and systems that are used for the production of oil and gas. The company is also involved in the high pressure fluid control products used in the energy industry. With oil at $100 it will result in hordes of cash on the books of the large energy companies. To appease the government and its shareholders, the companies will be forced to spend money on equipment and services. FTI will likely be one of the beneficiaries of the spending.
- Petrobras (PBR) is Brazil's largest industrial company and one of the largest oil companies in the world. PBR makes the list for two reasons. The demand for oil from emerging countries such as itself and China will continue with oil above $100 and PBR is positioned to remain a major supplier. In recent news the company announced a possible new oil discovery that could boost the country's oil reserves by as much as 50%. If it turns out the discovery can be drilled, PBR will quickly move up the ranks of top oil companies.
- The PowerShares Global Clean Energy ETF (PBD) is composed of a basket of alternative energy stocks that always find the spotlight when oil rises. Because many of the clean energy alternatives are expensive to implement, when oil rises to $100 they suddenly become more attractive. Add in the "green movement" around the globe and it is a no-brainer that money will be flowing into the clean energy stocks.
- The Market Vectors Nuclear Energy ETF (NLR) might be a controversial investment for some, but the bottom line is that if the US wants to lessen its dependence on fossil fuels, more nuclear power plants must be built. Not only is nuclear power prevalent throughout the world, it has been proven to be safe and less harmful to the environment. NLR gives investors exposure to the nuclear energy industry through mining, infrastructure, and power generation stocks.
- Monsanto (MON) is an agriculture company whose products help farmers grow bigger and better crops. Through biotechnology the firm focuses on improving crops with seeds and herbicides. With oil at lofty levels it increases the demand for ethanol that requires big crops of corn. The farmers will look to companies such as MON to provide them with the products needed to produce large amount of corn and other crops.
Top 20 VIX Correlated ETFs: All ProShares
I've covered the VIX and the best way to own a pseudo "VIX ETF" in the past, and given the high-volatility regime we've seen over the past few months, I figured it would be a good time to update this data.
I've calculated the daily log-return correlation of the closing prices of the VIX and 1100 ETFs and CEFs, and the top 20 are shown below. The results are dramatic, as literally every fund is a ProShares fund, and 14 of 20 are UltraShort funds.
As the ProShares Ultra ETFs are based on futures, they tend to need an above-average allocation of risk-free assets (e.g. bonds or money market holdings) to achieve the prescribed double-leverage. I think the results here indicate that either the underlying futures markets are being used as a volatility hedge, or that ProShares themselves are putting some of that unused risk-free capital to invest in long-volatility contracts.
click to enlarge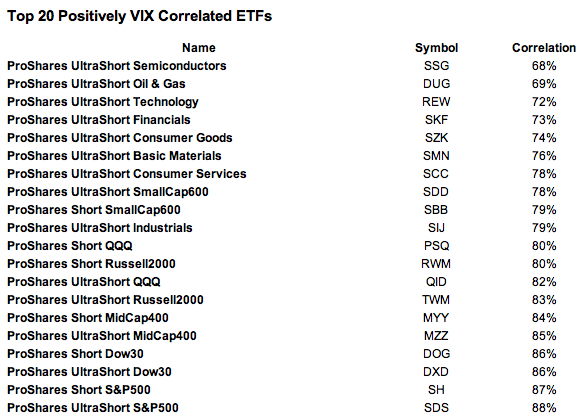
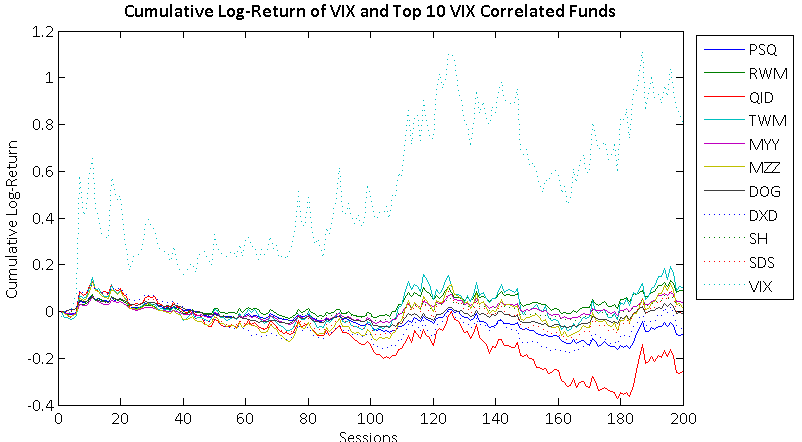
I've additionally included a few other interesting pieces. Below is the cumulative log-return of the VIX and the top 10 of the above 20 funds. Note that although they are all very directionally correlated, the nonlinear magnitude changes of the VIX results in dramatic differences in accumulated returns. This demonstrates that although these funds may provide effective short-term proxies, there is no substitute for a long-term long-volatility contract in the current ETF market.
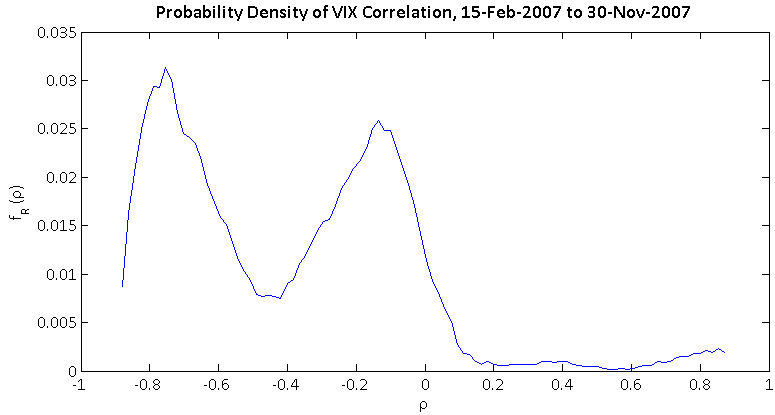
For those interested in the distribution of VIX correlation across the entire ETF market, here is the probability density of correlation against the VIX for 1,100 ETFs and CEFs. Note its bimodal nature, with a large number of strongly negatively correlated funds and a large number of mildly negatively correlated funds. Only 8% of all funds are non-negatively correlated with the VIX.
Subscribe to:
Posts (Atom)


