China Automotive Systems: Revving Up For Growth

China Automotive Systems (CAAS) has posted a couple of strong quarters lately, but the stock price has been inconsistent.

In Q2 of 2007, China Automotive Systems reported revenue of 36.31 million and earnings per diluted share of 0.10. CAAS’s revenue and earnings in Q2 were considerable improvements both sequentially and year over year.

In Q3 of 2007, China Automotive Systems reported revenue of 31.20 million and earnings per diluted share of 0.11. Revenues were up year over year but down sequentially due to seasonality of the Chinese passenger vehicle market. Earnings per share, however, improved both sequentially and year over year.

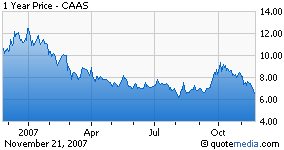
The fundamentals of CAAS have been improving but the stock price of China Automotive Systems has been behaving erratically. In September and October, the stock price of CAAS was trading above nine dollars and briefly traded over ten dollars. I don’t think the upward movement in CAAS’s stock price had much to do with Q2 earnings. The stock price barely reacted to this news. However, I think some of the big institutions shifted money into Chinese stocks due to the falling dollar (a lot of Chinese companies went up around this time).

The stock price of CAAS has been drifting down since its peak in October. The main reason for this is the CEO and COO sold some shares early in October. The stock price of CAAS has continued to go down since that time but I think now is a good time to pick up some shares.

China Automotive System’s stock price is currently trading near its support and I don’t think the stock price will go much lower. The fundamentals of China Automotive Systems are improving and the stock price will reflect this over time. Also, the Chinese automotive market continues to show strong growth. The CEO of CAAS stated the “Chinese domestic auto industry grew by 27% in the first nine months of 2007.”

CAAS is also trading at a nice valuation. At yesterday’s closing price of $6.40, it has a trailing PE of 19. That is very reasonable for a growing company.

I am going to reiterate my buy recommendation at yesterday’s closing price.

Disclosure: none

Solar stocks no longer the favorite of the people

Solar stocks have been hit Monday by news that Senate and House Democratic leaders are considering a plan to leave renewable energy out of a pending U.S. energy bill. An alert posted Friday by the Solar Energy Industries Association on its web site says that “there are widespread reports that a decision has been made, at least provisionally, to move energy legislation without a tax title that extends the Solar Investment Tax Credits.”

The notice asserts that “a bill without the solar ITC provisions would be a tremendous lost opportunity for our industry and our country.”

Stephen Chin, an analyst at UBS, this morning asserted that removal of the tax credits from the energy bill “increases the likelihood that the credits could expire in 2008.” He writes that “an orphaned solar ITC may not find bipartisan support during an election year, increasing the likelihood of expiration.”

Chin says that the current tax credit allows commercial system owners a 30% tax credit against total system costs. Expiration of the tax credit, he says, would likely reduce solar system demand among commercial customers, which accounted for 41% of 2006 solar installations. He adds that utilities may be slow to embrace solar if a provision allowing them to take the 30% tax credit isn’t passed.

Chin notes that Applied Materials (AMAT) could see decreased demand for solar-related equipment without the tax credit, and that there also could be a negative impact on solar-wafer producer MEMC Electronic Materials (WFR), pointing out that its largest customer, Suntech (STP), is “increasingly exposed” to the U.S. solar market.

Solar stocks are suffering significant losses Monday:

  • First Solar (FSLR) is down $22.11, or 10.7%, to $184.74.
  • Suntech (STP) is down $5.22, or 8.5%, to $56.33.
  • SunPower (SPWR) is down $15.57, or 12.1%, to $113.13.
  • MEMC (WFR) is down $3.04, or 4.3%, to $68.12.
  • Applied Materials (AMAT) is down 28 cents, or 1.5%, at $18.43.
  • JA Solar (JASO) is down $3.84, or 7%, at $50.67.
  • Evergreen Solar (ESLR) is down $1.28, or 9.1%, at $12.80.
  • Canadian Solar (CSIQ) is down 75 cents, or 6.7%, at $10.37.
  • LDK Solar (LDK) is down $2.35, or 5.8%, at $38.07.
  • Yingli Green Energy (YGE) is down $4.05, or 12.7%, at $27.80.

Should I buy-and-hold or trade?

Reader's Question: How does a buy-and-hold strategy compare to a trading strategy for ETFs [and stocks in general]?

Your question pertains specifically to exchange-traded funds (ETFs); however, because the buy-and-hold versus trade decision is basically the same for individual stocks, I will answer within the general context of equity-style investing.

Investing vs. Trading

The primary difference between a buy-and-hold approach to investing and a trading strategy is one's time horizon. To some extent, the distinction is relative: a day-trader considers any holding period longer than a day or two to be investing, whereas a buy-and-hold investor might consider any portfolio with turnover exceeding just 10% or 20% per annum to be trading. For concreteness, however, let's define "investing" as holding any position for a year or longer, in line with the cut-off for tax purposes between long-term and short-term capital gains. Within this definition, managers running portfolios with turnover exceeding 100% per year will be deemed to be "trading."

Rationally speaking, the decision to invest or trade should be based on your assessment of two quantities:

  • "Pick-Up" in Expected Return: How much pick-up in return do you expect to gain by trading, i.e., by switching from one asset to another, such as selling one stock to buy another?

  • "Frictional" Costs of Trading: What are the frictional costs including broker's commissions, bid-offer spread, tax impact of trading, and additional administrative time required to keep your records in order and account for trades?


  • Whenever expected pick-up exceeds frictional costs, it makes sense to trade out of one asset and into another that promises the higher return.

    If markets are efficient, with perfect and instantaneous information flow among all participants, no pick-up in expected return should be available from switching out of one asset and into another; instead, frictional costs will only drag down returns. On the other hand, if it is possible to use available information to one's advantage to outsmart others, then trading can be a highly profitable business.

    Prominent Winners and Losers

    A glance at popular lists of the rich and famous shows that at least a few people have been amazingly successful trading the markets. Here are some well-known traders on the Forbes list of the 400 wealthiest Americans:

  • George Soros (age 77): #33 on list, $8.8 billion net worth. Bachelor’s, London School of Economics. Founded Quantum Fund with Jim Rogers. With Stanley Druckenmiller, "broke" British pound in 1992, made $1 billion profit. Lost hundreds of millions with ill-timed investments in former Soviet Union 1996.

  • Steven Cohen (51): #47, $6.8 billion. Bachelor’s, Wharton, U. Penn. Founded hedge fund SAC Capital 1992 with $25 million in assets. Today manages $14 billion. Charges 3% of assets, 35% of profits; has returned an average of 34% net of fees each year since 1992.

  • James Simons (69): #57, $5.5 billion. Math Ph.D., UC Berkeley. Founded Renaissance Technologies 1982. Quantitative hedge fund uses complex computer models to analyze and trade securities. Fees as high as 5% of assets, 44% of profits. A $2.5 million investment in his funds in 1990 would be worth $1 billion today (for a 42% annualized return). Hires Ph.D.s over M.B.A.s. $25 billion institutional fund RIEF so far performing below expectations.

  • Stanley Druckenmiller (54): #91, $3.5 billion. Bachelor’s, Bowdoin College. Orchestrated billion-dollar raid on the British pound in 1992 with timely short position. Believed to help generate string of 30% returns for Soros' Quantum Fund. Duquesne Capital Management, runs No Margin Fund.

  • Bruce Kovner (62): #91, $3.5 billion. Bachelor’s, Harvard. Started trading soybeans; turned $3,000 he borrowed on his credit card into $45,000. Forgot to hedge, lost half the profits. Founded Caxton Associates 1983. Caxton Global Investments hedge fund has returned 25% annually net of fees. Assets: $15 billion.

  • Paul Tudor Jones II (53): #105, $3.3 billion. Economics, Bachelor’s, Univ. of Virginia. Early success trading cotton on Wall Street. Founded Tudor Investment Corp. hedge fund 1980. Predicted 1987 stock market crash, returned 125% net of fees that year. Assets now $20 billion. Estimated average annual returns 24%; down this year amid summer's violent market turmoil.

  • Kenneth Griffin (38): #117, $3.0 billion. Bachelor’s, Harvard. Started investing as undergrad, managing $1 million of family's, friend's money by senior year. Founded Citadel Investment Group 1990 with Frank Meyer's money. His hedge funds said to have averaged 20% net of fees annually. Assets under management exceed $16 billion.

  • David Shaw (56): #165, $2.5 billion. Ph.D., Stanford. Investment geek uses complex algorithms to capitalize on tiny anomalies in the stock market. Former professor of computer science at Columbia U. Launched hedge fund D.E. Shaw & Co. Assets have swelled from $28 million to $34 billion in 20 years (or 43% annual compounded asset accumulation).

  • David Tepper (49): #239, $2.0 billion. M.B.A., Carnegie Mellon. Ran junk bond desk at Goldman Sachs. Started hedge fund Appaloosa Management in 1992. Fund up 150% in 2003; believed to have averaged 30% returns net of fees since inception. Manages $7 billion.

  • Louis Bacon (51): #286, $1.7 billion. Literature, Bachelor’s, Middlebury College. Founded Moore Capital in 1989; returned 86% in first year on savvy bet that Gulf war would drive up oil prices. Assets under management: $13 billion. Last year returned 16.7% after fees (25% of profits, 3% of assets).

  • Daniel Och (46): #317, $1.5 billion. Bachelor’s, Wharton, Univ. of Penn. Took job in arbitrage at Goldman Sachs 1982; worked with Eddie Lampert , billionaire Richard Perry. Left to found Och-Ziff hedge fund with $100 million initial investment from Ziff brothers. Consistent returns: 16.5% a year after fees. Manages $29.1 billion.

  • Israel Englander (59): #317, $1.5 billion. Bachelor’s, NYU. Founded investment outfit Jamie Securities 1980s; firm collapsed. Created Millennium Partners 1990; fund said to have returned 17% net of fees. Assets under management $11.5 billion. Employees created 100 legal shell companies in order to market time mutual funds.


  • The persistent 15% t0 40% or higher annual returns these traders show is evidence that it is possible to realize consistent profits trading the market.

    Lest we become too carried away with these success stories, we should also keep in mind that there have been many equally prominent "blow-ups" of risk-taking traders, including: Victor Niederhoffer, one of Soros's former colleagues, whose funds failed twice, in 1997 and again this year; John Meriwether's Long-Term Capital Management, the multi-billion dollar hedge fund run by ex-Salmon traders and even a couple of economics Nobel prize winners, which collapsed in 1997; and Amaranth Advisors, which spectacularly lost $6 billion in one week on natural gas futures in September 2006. This year's subprime crisis is another example of how businesses, investments and trading strategies that have been profitable for many years can suddenly turn sour. Then, too, think about all the unlucky traders who lose money so quickly that we never get a chance even to hear about them!

    Base Strategy: Buy-and-Hold

    The only certain way to know whether you yourself have the ability become a successful trader is to commit both significant time and capital to trying. Unfortunately, most people have neither the time nor capital to spend finding out. Also, for those who seriously begin trading but fail, the costs can be very high, both financailly and emotionally.

    In my opinion, instead of launching off and haphazardly trying your luck at trading, it makes sense at least initially to pursue a buy-and-hold strategy to exploit certain advantages it offers:

    1. Long-Term Returns Favor Equities: The nature of capitalism as we know it in the U.S. and in most parts of the world is that laws and regulations are skewed to promote economic growth, corporate profits, and wealth generation for stockholders. In this environment, risk-taking buy-and-hold equity holders more often than not end up with higher returns than bondholders and cash-rich non-risk-takers. Therefore, it makes sense to allocate as much of your portfolio as you can to equities, reserving for cash and bonds only what you need for emergency living expenses (e.g., six months' income in case you lose your job) or predictable future expenses (e.g., a college fund for children). While it is very difficult to predict whether equities will outperform bonds and cash in any given year, over periods of 10 or 20 years or longer, equities have generally outperformed.

    2. Cost Efficiency: Compared to trading, buy-and-hold investing controls costs by keeping broker's commissions and other frictional costs to a minimum. Though not as evident as a trading commission, the bid-offer spread is a cost that can often be larger than commissions. To give an extreme example, a micro-cap "penny" stock with a $0.06-$0.08 bid-offer (you can buy at $0.08 and sell at $0.06 in an unchanged market) actually has round-trip execution costs of an enormous 25% of one's initial investment! At the other end of the spectrum are exchange-traded funds, the most liquid of which is the S&P Depositary Receipts (AMEX: SPY) with round-trip bid-offer costs of just 0.007% (or less than 1 b.p.). More typically, moderately liquid mid-cap individual stocks have bid-offer spreads of about 0.50% (50 b.p.).

    3. Tax Efficiency: Keeping portfolio turnover to a minimum through buy-and-hold investing is also more efficient from a tax point of view. First of all, the long-term capital gains tax rate of 15% that applies to positions held for more than a year is substantially lower than the ordinary income tax rate running as high as 28% that applies to short-term capital gains on positions held for a year or less. For certain types of trading accounts, the IRS offers a favorable 60%/40% split between long-term and short-term capital gains tax treatment, which produces an effective tax rate of 20.2% (of course, higher than the 15% pure long-term gains rate). Also, since taxes on gains are due only when securities are eventually sold, capital gains tax can be deferred indefinitely into the future through extending buy-and-hold positions without selling for many years.

    While it may seem simplistic, a buy-and-hold approach to investing, characterized by continuously holding a very high percentage of equities with only very infrequent though carefully considered buy-sell decisions, can, in my opinion, give small retail investors a slight "edge" over other investors and traders based on the efficiencies cited above.

    Numerical Comparison

    To gauge the impact of frictional costs on returns, let's compare two portfolios over a 10-year period in a market that returns 10% annually:

  • Buy-and-Hold: Assume no turnover. At 10% annual appreciationn, $100 grows to $259 after 10 years. After payment of 15% long-term capital gains tax on the $159 gain at the end of year 10, the net portfolio value becomes $235, for an annualized after-tax return of 8.94%.

  • Trading: Assume 200% annual turnover, or the equivalent of two round-trip trades per year at a cost of 0.50% per round-trip. Trading costs as stated and annual taxes of 28% on short-term gains reduce the 10% annual market appreciation to (10% - 2 x 0.50%) x (1 - 0.28), or 6.48%. At this after-tax growth rate, an original $100 investment becomes $187 after 10 years.


  • Assuming that trading produces no pick-up in return, the frictional trading costs and additional tax lead to an inferior after-tax annual return 246 b.p. lower (8.94% vs. 6.48%) than the return available through buy-and-hold investing. On a pre-cost, pre-tax breakeven basis, the trading strategy will need to outperform the buy-and-hold alternative by a full 342 b.p. annually in order for trading to beat the buy-and-hold alternative.

    As a rough rule of thumb, then, you should engage in trading only if you honestly believe that your buy-sell decisions give you at least a three or four percentage point advantage annually (and more if your turnover exceeds 200% per year) above the buy-and-hold alternative.

    Self-Assessment: What's My Trading "Edge"?

    Expressed another way, the buy-and-hold versus trading decision really boils down to having an "edge" large enough to overcome the costs of trading. What in particular about you, your personality, your abilities, and your current situation gives you a competitive advantage over others in the market? Based on the information you can easily get your hands on, digest and analyze, do you have an edge over professionals who devote themselves full-time and make careers out of trading the market?

    While a genius-level of business and financial acumen may not be strictly necessary for wealth-building, I would contend that your odds of becoming a successful investor or trader will be greatly enhanced if you know what your edge is. If you plan to trade ETFs or large-cap stocks over a short-term time horizon, keep in mind that you'll be competing with Wall Street traders and hedge funds who usually have access to more up-to-the-minute newswires, customer flow information, and analytical tools than you do. Your odds of success may be slightly better in small-cap and penny stocks, asset classes that more sophisticated investors often avoid due to limited liquidity and trade size (Tim Sykes, whose claim to fame is trading his way from $12,415 to $1.65 million in just four years, day-trades small-cap stocks and is attempting to teach us all how it can be done again).

    Over the years I have looked at many fundamental, technical and sentiment-based possibilities for constructing a system for beating the market, always searching for a methodology to ensure at least a 70% winning trade percentage. From one (perhaps too naive and hopeful?) point of view, given how readily availability price, volume, earnings and other quantifiable time series are, it seems that trading ought to be a "science" amenable to analysis and predictability. Unfortunately, from what I have seen so far, analytical trading rules do not appear to produce excess returns in any consistent and reliable way. Also, to date, I have yet to meet anyone who has a trading system that runs without human intervention and produces consistent excess returns. From what I can tell, trading is more like a game involving both luck and skill than a predictive science.

    To Trade or Not To Trade?

    Whether to engage in buy-and-hold investing or to pursue a short- or middle-term trading strategy, then, really depends on your own abilities and risk preferences. For the vast majority of people, I suspect that a buy-and-hold strategy will bear larger and more fruit than an active trading strategy. In my own case, I currently follow a buy-and-hold approach, targeting no more than 10% annual turnover to keep trading costs and taxes at a minimum.

    Concurrently, I continue my search for a Holy Grail of sorts that is capable of producing winning trades at least 70% of the time (which I view as equivalent to a low-C grade, i.e., barely passing). The day I convince myself that I have a working system that meets this 70% threshold, I will begin to trade, putting real money at risk.

    By the way, to anyone reading this: If you or someone you know has a trading system that produces consistent and reliable above-market returns, and don't mind sharing a little information about it, please leave a comment. We would all love to hear about it.
    Should I buy-and-hold or trade?

    Reader's Question: How does a buy-and-hold strategy compare to a trading strategy for ETFs [and stocks in general]?

    Your question pertains specifically to exchange-traded funds (ETFs); however, because the buy-and-hold versus trade decision is basically the same for individual stocks, I will answer within the general context of equity-style investing.

    Investing vs. Trading

    The primary difference between a buy-and-hold approach to investing and a trading strategy is one's time horizon. To some extent, the distinction is relative: a day-trader considers any holding period longer than a day or two to be investing, whereas a buy-and-hold investor might consider any portfolio with turnover exceeding just 10% or 20% per annum to be trading. For concreteness, however, let's define "investing" as holding any position for a year or longer, in line with the cut-off for tax purposes between long-term and short-term capital gains. Within this definition, managers running portfolios with turnover exceeding 100% per year will be deemed to be "trading."

    Rationally speaking, the decision to invest or trade should be based on your assessment of two quantities:

  • "Pick-Up" in Expected Return: How much pick-up in return do you expect to gain by trading, i.e., by switching from one asset to another, such as selling one stock to buy another?

  • "Frictional" Costs of Trading: What are the frictional costs including broker's commissions, bid-offer spread, tax impact of trading, and additional administrative time required to keep your records in order and account for trades?


  • Whenever expected pick-up exceeds frictional costs, it makes sense to trade out of one asset and into another that promises the higher return.

    If markets are efficient, with perfect and instantaneous information flow among all participants, no pick-up in expected return should be available from switching out of one asset and into another; instead, frictional costs will only drag down returns. On the other hand, if it is possible to use available information to one's advantage to outsmart others, then trading can be a highly profitable business.

    Prominent Winners and Losers

    A glance at popular lists of the rich and famous shows that at least a few people have been amazingly successful trading the markets. Here are some well-known traders on the Forbes list of the 400 wealthiest Americans:

  • George Soros (age 77): #33 on list, $8.8 billion net worth. Bachelor’s, London School of Economics. Founded Quantum Fund with Jim Rogers. With Stanley Druckenmiller, "broke" British pound in 1992, made $1 billion profit. Lost hundreds of millions with ill-timed investments in former Soviet Union 1996.

  • Steven Cohen (51): #47, $6.8 billion. Bachelor’s, Wharton, U. Penn. Founded hedge fund SAC Capital 1992 with $25 million in assets. Today manages $14 billion. Charges 3% of assets, 35% of profits; has returned an average of 34% net of fees each year since 1992.

  • James Simons (69): #57, $5.5 billion. Math Ph.D., UC Berkeley. Founded Renaissance Technologies 1982. Quantitative hedge fund uses complex computer models to analyze and trade securities. Fees as high as 5% of assets, 44% of profits. A $2.5 million investment in his funds in 1990 would be worth $1 billion today (for a 42% annualized return). Hires Ph.D.s over M.B.A.s. $25 billion institutional fund RIEF so far performing below expectations.

  • Stanley Druckenmiller (54): #91, $3.5 billion. Bachelor’s, Bowdoin College. Orchestrated billion-dollar raid on the British pound in 1992 with timely short position. Believed to help generate string of 30% returns for Soros' Quantum Fund. Duquesne Capital Management, runs No Margin Fund.

  • Bruce Kovner (62): #91, $3.5 billion. Bachelor’s, Harvard. Started trading soybeans; turned $3,000 he borrowed on his credit card into $45,000. Forgot to hedge, lost half the profits. Founded Caxton Associates 1983. Caxton Global Investments hedge fund has returned 25% annually net of fees. Assets: $15 billion.

  • Paul Tudor Jones II (53): #105, $3.3 billion. Economics, Bachelor’s, Univ. of Virginia. Early success trading cotton on Wall Street. Founded Tudor Investment Corp. hedge fund 1980. Predicted 1987 stock market crash, returned 125% net of fees that year. Assets now $20 billion. Estimated average annual returns 24%; down this year amid summer's violent market turmoil.

  • Kenneth Griffin (38): #117, $3.0 billion. Bachelor’s, Harvard. Started investing as undergrad, managing $1 million of family's, friend's money by senior year. Founded Citadel Investment Group 1990 with Frank Meyer's money. His hedge funds said to have averaged 20% net of fees annually. Assets under management exceed $16 billion.

  • David Shaw (56): #165, $2.5 billion. Ph.D., Stanford. Investment geek uses complex algorithms to capitalize on tiny anomalies in the stock market. Former professor of computer science at Columbia U. Launched hedge fund D.E. Shaw & Co. Assets have swelled from $28 million to $34 billion in 20 years (or 43% annual compounded asset accumulation).

  • David Tepper (49): #239, $2.0 billion. M.B.A., Carnegie Mellon. Ran junk bond desk at Goldman Sachs. Started hedge fund Appaloosa Management in 1992. Fund up 150% in 2003; believed to have averaged 30% returns net of fees since inception. Manages $7 billion.

  • Louis Bacon (51): #286, $1.7 billion. Literature, Bachelor’s, Middlebury College. Founded Moore Capital in 1989; returned 86% in first year on savvy bet that Gulf war would drive up oil prices. Assets under management: $13 billion. Last year returned 16.7% after fees (25% of profits, 3% of assets).

  • Daniel Och (46): #317, $1.5 billion. Bachelor’s, Wharton, Univ. of Penn. Took job in arbitrage at Goldman Sachs 1982; worked with Eddie Lampert , billionaire Richard Perry. Left to found Och-Ziff hedge fund with $100 million initial investment from Ziff brothers. Consistent returns: 16.5% a year after fees. Manages $29.1 billion.

  • Israel Englander (59): #317, $1.5 billion. Bachelor’s, NYU. Founded investment outfit Jamie Securities 1980s; firm collapsed. Created Millennium Partners 1990; fund said to have returned 17% net of fees. Assets under management $11.5 billion. Employees created 100 legal shell companies in order to market time mutual funds.


  • The persistent 15% t0 40% or higher annual returns these traders show is evidence that it is possible to realize consistent profits trading the market.

    Lest we become too carried away with these success stories, we should also keep in mind that there have been many equally prominent "blow-ups" of risk-taking traders, including: Victor Niederhoffer, one of Soros's former colleagues, whose funds failed twice, in 1997 and again this year; John Meriwether's Long-Term Capital Management, the multi-billion dollar hedge fund run by ex-Salmon traders and even a couple of economics Nobel prize winners, which collapsed in 1997; and Amaranth Advisors, which spectacularly lost $6 billion in one week on natural gas futures in September 2006. This year's subprime crisis is another example of how businesses, investments and trading strategies that have been profitable for many years can suddenly turn sour. Then, too, think about all the unlucky traders who lose money so quickly that we never get a chance even to hear about them!

    Base Strategy: Buy-and-Hold

    The only certain way to know whether you yourself have the ability become a successful trader is to commit both significant time and capital to trying. Unfortunately, most people have neither the time nor capital to spend finding out. Also, for those who seriously begin trading but fail, the costs can be very high, both financailly and emotionally.

    In my opinion, instead of launching off and haphazardly trying your luck at trading, it makes sense at least initially to pursue a buy-and-hold strategy to exploit certain advantages it offers:

    1. Long-Term Returns Favor Equities: The nature of capitalism as we know it in the U.S. and in most parts of the world is that laws and regulations are skewed to promote economic growth, corporate profits, and wealth generation for stockholders. In this environment, risk-taking buy-and-hold equity holders more often than not end up with higher returns than bondholders and cash-rich non-risk-takers. Therefore, it makes sense to allocate as much of your portfolio as you can to equities, reserving for cash and bonds only what you need for emergency living expenses (e.g., six months' income in case you lose your job) or predictable future expenses (e.g., a college fund for children). While it is very difficult to predict whether equities will outperform bonds and cash in any given year, over periods of 10 or 20 years or longer, equities have generally outperformed.

    2. Cost Efficiency: Compared to trading, buy-and-hold investing controls costs by keeping broker's commissions and other frictional costs to a minimum. Though not as evident as a trading commission, the bid-offer spread is a cost that can often be larger than commissions. To give an extreme example, a micro-cap "penny" stock with a $0.06-$0.08 bid-offer (you can buy at $0.08 and sell at $0.06 in an unchanged market) actually has round-trip execution costs of an enormous 25% of one's initial investment! At the other end of the spectrum are exchange-traded funds, the most liquid of which is the S&P Depositary Receipts (AMEX: SPY) with round-trip bid-offer costs of just 0.007% (or less than 1 b.p.). More typically, moderately liquid mid-cap individual stocks have bid-offer spreads of about 0.50% (50 b.p.).

    3. Tax Efficiency: Keeping portfolio turnover to a minimum through buy-and-hold investing is also more efficient from a tax point of view. First of all, the long-term capital gains tax rate of 15% that applies to positions held for more than a year is substantially lower than the ordinary income tax rate running as high as 28% that applies to short-term capital gains on positions held for a year or less. For certain types of trading accounts, the IRS offers a favorable 60%/40% split between long-term and short-term capital gains tax treatment, which produces an effective tax rate of 20.2% (of course, higher than the 15% pure long-term gains rate). Also, since taxes on gains are due only when securities are eventually sold, capital gains tax can be deferred indefinitely into the future through extending buy-and-hold positions without selling for many years.

    While it may seem simplistic, a buy-and-hold approach to investing, characterized by continuously holding a very high percentage of equities with only very infrequent though carefully considered buy-sell decisions, can, in my opinion, give small retail investors a slight "edge" over other investors and traders based on the efficiencies cited above.

    Numerical Comparison

    To gauge the impact of frictional costs on returns, let's compare two portfolios over a 10-year period in a market that returns 10% annually:

  • Buy-and-Hold: Assume no turnover. At 10% annual appreciationn, $100 grows to $259 after 10 years. After payment of 15% long-term capital gains tax on the $159 gain at the end of year 10, the net portfolio value becomes $235, for an annualized after-tax return of 8.94%.

  • Trading: Assume 200% annual turnover, or the equivalent of two round-trip trades per year at a cost of 0.50% per round-trip. Trading costs as stated and annual taxes of 28% on short-term gains reduce the 10% annual market appreciation to (10% - 2 x 0.50%) x (1 - 0.28), or 6.48%. At this after-tax growth rate, an original $100 investment becomes $187 after 10 years.


  • Assuming that trading produces no pick-up in return, the frictional trading costs and additional tax lead to an inferior after-tax annual return 246 b.p. lower (8.94% vs. 6.48%) than the return available through buy-and-hold investing. On a pre-cost, pre-tax breakeven basis, the trading strategy will need to outperform the buy-and-hold alternative by a full 342 b.p. annually in order for trading to beat the buy-and-hold alternative.

    As a rough rule of thumb, then, you should engage in trading only if you honestly believe that your buy-sell decisions give you at least a three or four percentage point advantage annually (and more if your turnover exceeds 200% per year) above the buy-and-hold alternative.

    Self-Assessment: What's My Trading "Edge"?

    Expressed another way, the buy-and-hold versus trading decision really boils down to having an "edge" large enough to overcome the costs of trading. What in particular about you, your personality, your abilities, and your current situation gives you a competitive advantage over others in the market? Based on the information you can easily get your hands on, digest and analyze, do you have an edge over professionals who devote themselves full-time and make careers out of trading the market?

    While a genius-level of business and financial acumen may not be strictly necessary for wealth-building, I would contend that your odds of becoming a successful investor or trader will be greatly enhanced if you know what your edge is. If you plan to trade ETFs or large-cap stocks over a short-term time horizon, keep in mind that you'll be competing with Wall Street traders and hedge funds who usually have access to more up-to-the-minute newswires, customer flow information, and analytical tools than you do. Your odds of success may be slightly better in small-cap and penny stocks, asset classes that more sophisticated investors often avoid due to limited liquidity and trade size (Tim Sykes, whose claim to fame is trading his way from $12,415 to $1.65 million in just four years, day-trades small-cap stocks and is attempting to teach us all how it can be done again).

    Over the years I have looked at many fundamental, technical and sentiment-based possibilities for constructing a system for beating the market, always searching for a methodology to ensure at least a 70% winning trade percentage. From one (perhaps too naive and hopeful?) point of view, given how readily availability price, volume, earnings and other quantifiable time series are, it seems that trading ought to be a "science" amenable to analysis and predictability. Unfortunately, from what I have seen so far, analytical trading rules do not appear to produce excess returns in any consistent and reliable way. Also, to date, I have yet to meet anyone who has a trading system that runs without human intervention and produces consistent excess returns. From what I can tell, trading is more like a game involving both luck and skill than a predictive science.

    To Trade or Not To Trade?

    Whether to engage in buy-and-hold investing or to pursue a short- or middle-term trading strategy, then, really depends on your own abilities and risk preferences. For the vast majority of people, I suspect that a buy-and-hold strategy will bear larger and more fruit than an active trading strategy. In my own case, I currently follow a buy-and-hold approach, targeting no more than 10% annual turnover to keep trading costs and taxes at a minimum.

    Concurrently, I continue my search for a Holy Grail of sorts that is capable of producing winning trades at least 70% of the time (which I view as equivalent to a low-C grade, i.e., barely passing). The day I convince myself that I have a working system that meets this 70% threshold, I will begin to trade, putting real money at risk.

    By the way, to anyone reading this: If you or someone you know has a trading system that produces consistent and reliable above-market returns, and don't mind sharing a little information about it, please leave a comment. We would all love to hear about it.

    Housing Bubble and Real Estate Market Tracker

    Here's our summary of articles and data points on the housing market. It's part of Seeking Alpha's coverage of the real estate market and homebuilder stocks. Like all other topics and stock coverage from Seeking Alpha, you can have this sent to your Blackberry or desktop email by signing up for our no-spam free email subscription service.
    Quote of the Day- "From the House's Mouth"

    "Wall Street strategies that made the cycle of no-money-down, no-questions-asked lending possible have sucked the life out of my city" - Jim Rokakis, County Treasurer for Cleveland's Cuyahoga County, on the foreclosure crisis in Cleveland. (BBC.com, Nov. 5th)

    Real Estate Sales and House Prices

    • Otteau Valuation Group November Newsletter (NJ Report, Nov. 6th): "New Jersey home purchase activity in September, as measured by signed contracts, declined 23% from August and was 17% below the year-ago level in September 2006... In New Jersey, sub-prime mortgage originations occurred at modest levels relative to the rest of the nation and foreclosure activity is only slightly elevated from last year’s pace, [yet] potential home buyers continue to hold off which is causing further erosion of market dynamics... Unsold Inventory of homes for sale in New Jersey... represents a 13-month supply on the market, up from 7 months in March and 10 months in August."
    • Housing Glut Hits Home (Journal Gazette, Nov. 4th) Indiana: "Fort Wayne Area Association of Realtors' Multiple Listing Service: Allen County homes are taking an average of 96 days to sell... [That's] 13 days longer than five years ago... Multiple Listing Service: Inventory hit a high of 3,329 houses in August... nearly 22% higher than in August 2005 when 2,739 Allen County residential properties were up for sale... Three hundred more workers lost their jobs Monday when Kitty Hawk Inc. shut down its Fort Wayne sorting operation, possibly increasing the pressure on the local housing market... RealtyTrac: Indiana had 9,087 properties with foreclosure filings in Q3, 10% higher than Q3'06."

    Mortgages and Real Estate Lending

    • Radian Declares Regular Quarterly Dividend on Common Stock (CNN News, Nov. 6th): "Radian Group Inc. (RDN) announced today a regular quarterly dividend on its common stock in the amount of $0.02/share, payable on December 18, 2007, to stockholders of record as of November 16, 2007. Radian is a global credit risk management company... Radian develops innovative financial solutions by applying its core mortgage credit risk expertise and structured finance capabilities to the credit enhancement needs of the capital markets worldwide, public finance, corporations and consumers."

    Global Housing Slump?

    • Bovis Gives Warning On Profits As Volumes Fall (Times Online, Nov. 6th) UK: "Bovis, the top 10 UK housebuilder, has given warning that faltering consumer confidence [and the credit crunch] has hit sales during the key autumn period... Malcolm Harris, CEO of Bovis: Profits for the full year would now be "slightly below" previous forecasts. Bovis has refused to cut the underlying prices of its properties in an effort to maintain margins but fewer sales this year will translate into a fall in profits. City analysts sliced £10 million off their 2007 pre-tax profit forecasts for Bovis from £139 million to £129M. Profits last year were 13.7% higher at £132M."

    Subprime Fallout

    • Bonus Pain Is Dish Still Served Bold (Wall St. Journal, Nov. 7th): "Executive-search company Options Group projects Wall St. bonuses will decrease 5%-10% from last year, the first overall drop in five years. Compensation consultant Johnson Associates: Bonuses will be flat, thanks to a relatively strong stock market and big profit gains in H1'07... Companies that have taken significant hits recently, such as Merrill Lynch & Co. and Citigroup Inc., could give smaller bonuses than those by more-successful rivals... Options Group projects an average 15%-20% decline in bonuses for people in bond and currency departments and a 10% rise for those in stocks. Those working in mortgages could see a 30% decline."
    • Bonus Pool Springs Leak (Crain's NY Business, Nov. 3rd): "State Comptroller's Office: Bonus checks, which account for the lion's share of bankers', brokers' and traders' annual pay, will be 10% smaller this year. That would mark the first drop since the technology stock meltdown early in the decade... Gustavo Dolfino, president of recruiter WhiteRock Group: In the past four months, close to 12,000 bond bankers and traders have lost their jobs... Most [of the following previously] announced layoffs are believed to be of NYC-based employees: BEAR STEARNS August 240; October 300. J.P. MORGAN CHASE October 2,500. MORGAN STANLEY October 200. CREDIT SUISSE October 170. BANK OF AMERICA October 3,000."
    • Avoid the U.S. Until the Subprime Mess Really Hits the Fan (Enzio Von Pfeil in Seeking Alpha, Nov. 6th): "My guess is that Q1'08 will be particularly messy. Once we get the first wounded companies reporting the extent of their damages, Wall Street will go wildly bearish... Lighten-up on your US exposure, except for tech stocks... [as] these are like "consumer staples" - people need tech such as search engines, regardless of what the economy does. We keep advising to avoid banks. Also add to this: mortgage-related finance companies. While we do maintain that America will fall strongly, buy on dips in China, Hong Kong, India and Malaysia."
    • ResMae Stops Funding Loans (OC Register, Nov. 6th): "ResMae Mortgage Corp. in Brea, California announced Tuesday: "Effective immediately we are temporarily suspending new loan originations... Our National Operations Center in Brea, CA will continue to support existing loans in the ResMAE pipeline and will continue to fund loans through their commitment expiration dates... Despite the suspension of loan originations, ResMAE will continue to operate its fully staffed loan servicing operation in Brea, CA." ResMae is a subprime lender that was scheduled to emerge from bankruptcy in June, after being acquired by Citadel Investment Group."
    • IndyMac’s Q3 Losses Surge (Roy Mehta in Seeking Alpha, Nov. 6th): "Alt-A Mortgage lender IndyMac Bancorp's first loss since 1999 [reached] $202.7 million ($-2.77/share) compared to a gain of $86.2M ($1.19/share) last year. Analysts had been expecting a $0.46/share loss. IndyMac took a $575 million credit-related charge, and halved its quartely dividend to $0.25/share. The company noted it held only $112 million in subprime, second-mortgages and home equity lines of credit as of Sept. 30 -- 0.3% of its total assets. Mortgage loan production fell 30% to $16.82 billion... The wider loss was a result of increasing loan losses and severance costs. IndyMac increased its credit reserves 47% to $1.39B."
    • MBIA, Ambac Losses Will Be `Massive,' Egan Jones Says (Bloomberg, Nov. 6th): " Egan-Jones Ratings Co.: Bond insurers including MBIA Inc. (MBI), Ambac Financial Group Inc. (ABK) and ACA Capital Holdings Inc. face "massive losses'' over the next few quarters that could test their ability to raise new capital. MBIA may lose $20.2 billion on guarantees and securities holdings. ACA Capital may [lose] $10B; Ambac may reach $4.3B; mortgage insurers MGIC Investment Corp. (MTG) and Radian Group Inc. (RDN) may see losses of $7.25B and $7.2B, respectively... Fitch Ratings said yesterday it [is] reviewing the capital of Ambac, MBIA, Financial Guaranty Insurance Co. and CIFG Guaranty to ensure they have enough capital to warrant an AAA rating."
    • GM Taking $39 Bln Non-Cash Charge In Third Quarter (MarketWatch, Nov. 6th): "General Motors Corp. (GM) said late Tuesday it will record a third-quarter non-cash charge of $39 billion because of accounting standards related to its deferred tax assets in the U.S., Canada and Germany. The company said the money is needed to establish a valuation allowance in part to compensate for unanticipated losses at GMAC Financial Services. GM is scheduled to report its third-quarter results on Wednesday."
    • Fitch Cuts Rating Outlook Of Wells Fargo, Wamu, Capital One (MarketWatch, Nov. 6th): "Fitch Ratings said Tuesday it revised rating outlooks for several major banks: Wells Fargo Co. (WFC) and Capital One Financial Corp.'s (COF) [were revised] to stable from positive, and Washington Mutual Inc.'s (WM) [went to] negative from stable. Fitch removed Countrywide Financial Corp. (CFC) from ratings watch and assigned it a negative outlook. Wells' Fitch debt is currently rated AA and Capital One Financial is A-. WaMu's rating is A and Countrywide's is at BBB+. The agency also cut National City Corp.'s (NCC) issuer default rating to A+ from AA- with a negative outlook and revised down KeyCorp (KEY)... to stable versus positive."
    • IndyMac Posts Loss, Morgan Stanley Writedown May Loom (Bloomberg, Nov. 6th): "Morgan Stanley, based in New York and the second-biggest U.S. securities firm, may write down $6 billion on the value of mortgages and related securities, Fox-Pitt Kelton analyst David Trone said in a note to clients... Bank of America and Wachovia, both based in Charlotte, North Carolina, may be forced to write down more mortgage-related assets in Q4, Friedman Billings Ramsey Group Inc. analyst Gary Townsend told investors."
    • Analyst Sees More Q4 Subprime Write-Downs (Yahoo! Finance, Nov. 5th): "Charles Peabody, partner at research firm Portales Partners LLC expects more write-downs from Citigroup [beyond the] $8B-$11 billion writedowns for subprime mortgages... Peabody also said there may be write-downs at Goldman Sachs Group Inc (GS)... and Lehman Brothers Holdings Inc (LEH): "I really don't believe those two organizations have come clean." Merrill Lynch & Co Inc (MER) was the only big Wall Street firm to post a third-quarter loss after writing down $8.4B on investments linked to subprime mortgages... Goldman, Bear Stearns Cos Inc (BSC), Morgan Stanley (MS.N) and Lehman have collectively written down $3.6 billion so far."

    Foreclosure Data

    • Cities Battle Default Wave (Sacramento Bee, Nov. 6th): "DataQuick Information Systems: More than 6,500 homeowners have lost houses this year to foreclosure in Amador, El Dorado, Nevada, Placer, Sacramento, Sutter, Yolo and Yuba counties. Three of every four are in Sacramento County... The nation's cities are taking numerous approaches as the foreclosure problem rolls from East to West. Jacksonville is offering no-interest $5,000 loans to help people with short-term mortgage problems. Chicago and Baltimore advertise a "311" telephone number for people behind on mortgage payments to call. Cleveland's suburban officials are fixing broken windows, mowing lawns and installing alarms in empty houses to keep neighborhoods stable."
    • Michael Jackson Neverland Ranch Appears in Foreclosure Report (Mortgage Lender Implode-o-Meter, Nov. 6th): "Michael Jackson's Neverland Ranch has appeared in the November 5th, 2007 Foreclosure Detail Report for Santa Barbara county. While the looming foreclosure of Neverland Ranch has received some coverage, this would appear to be hard confirmation of the event... and indication that it is still underway."
    • Foreclosure Wave Sweeps America (BBC News, Nov. 5th): "One in ten homes in Cleveland, Ohio is now vacant, and whole neighbourhoods have been blighted by foreclosed, vandalized and boarded-up homes... Many of these homes are now owned by the banks and investment pools owning the mortgages, and the company making the most foreclosures in Cleveland is Deutsche Bank Trust, acting on behalf of those pools... Claudia Coulton, co-director of the Centre for Urban Poverty at Case Western Reserve University in Cleveland: Over 10,000 families - one in eight of all owner occupiers in Cleveland - will face eviction this year - and the number is expected to rise."

    Macro Impact, And Will The Housing Slump Cause A Recession?

    • Schwarzenegger Orders State Agencies To Prepare For 10 Percent Cut As Budget Slides (My Desert.com, Nov. 6th) California: "Gov. Arnold Schwarzenegger has ordered state agencies to prepare a plan to cut 10% from their budgets as preliminary reports indicate that the subprime housing crunch will hit the California state budget harder than expected. The order, issued Monday, could affect agencies from education to healthcare to transportation. Reports indicate that the tax revenue fallout from the slump in the California housing market could push the governor's balanced budget into a $10 billion deficit."
    • Why the Fed Continues To Cut Rates (Tim Iacono in Seeking Alpha, Nov. 6th): "The government's inflation statistics do not track home prices directly. Instead, they use an estimate of what homes would rent for... What would the consumer price index look like if real home prices were used instead of owners' equivalent rent? The last couple months of plunging home prices would take the annual rate of inflation to zero (actually, it's still positive at 0.01%)... a big reason why we are in the mess we are in today is that inflation, with real home prices included, was much, much higher than inflation with OER back in 2003, 2004, and 2005 when interest rates and lending standards were at multi-generational lows."
    • Furniture Sales In Flux (Press Democrat, Nov. 4th) California: "The housing downturn and subprime mortgage meltdown are [hurting] many Sonoma County furniture retailers already reeling from competition from cheaper imports... Fewer home sales [and] sliding home values make it more difficult for consumers to tap evaporating equity. The slump that last year sank R.S. Basso in Sebastopol, and Colburn's Wood Furniture and Greenwood Home Furnishings in Santa Rosa has deepened... In addition to Bare Woods and Santa Rosa Bedding & Furniture, stores that have closed or are planning to close include Furniture 101, Black Sea Gallery and Red Tag Furniture in Santa Rosa, Furniture Solutions in Rohnert Park and Couches, Etc. in Petaluma."

    Homebuilders, Housing Stocks and Housing-Related Stocks

    • Questions Swirl on Levitt Unit (Wall St. Journal, Nov. 7th): "Shareholders: Levitt Corp. (LEV) could be on the verge of unloading its home-building unit, Levitt & Sons... Levitt would be getting rid of a troubled unit amid a crisis for home builders, [and] it would be [liable] for little of the subsidiary's debt... Parent company Levitt would be free to focus on its other ventures, such as its land-development unit, Core Communities LLC, and Bluegreen Corp., a developer of vacation resorts in which it has a 31% stake... Eric Landry, Morningstar analyst, [cited] roughly $400 million of $654M in debt the parent company could eliminate or restructure through a bankruptcy."
    • Ryland: Charlotte 'Reasonably OK' Right Now (CNN Money, Nov. 6th) North Carolina: "[Since] Charlotte is doing "reasonably OK" in this crumbling housing market - it is excluded from Ryland Group Inc.'s (RYL) " Savings Spectacular" deal this weekend... Ryland is offering savings as high as 25% from Friday through Sunday. Sale markets include Las Vegas, Phoenix, Baltimore, Northern and Southern California, Denver, and Chicago. In Las Vegas, the three-bedroom " Shasta" model is now $368,823, down from $533,823, Ryland said. Ryland is the latest to try a fire sale. Hovnanian Enterprises Inc. (HOV), Standard Pacific Corp. (SPF) and Pulte Homes Inc. (PHM) have all said their similar deals were successful."
    • Shareholder Group Calls for Beazer Chief's Ouster (Builder Online, Nov. 6th): "Citing a lack of leadership, federal investigations, and a downward spiral of stock value, the CtW Investment Group [a major Beazer shareholder] wants... the immediate removal of CEO Ian J. McCarthy... CtW: "Mr. McCarthy was paid over $57 million in total compensation over the past five years, including $22M in 2006 alone... among the very highest for similarly sized firms. On top of that, Mr. McCarthy executed his largest ever sale of company stock - 179.535 shares at $43.07 each, totaling $7.7M- last November, less than two months before the stock began its steady collapse to its current $9.52/share."
    • A Home Builder That Saves Your Hand From Scalding (Mercury News, Square Feet Blog, Nov. 6th): "At least one builder is targeting consumers at a crucial source -- our point of caffeine acquisition. I ordered tea at Mission City Coffee Roasting Co. in Santa Clara this morning and the little jacket around the paper cup featured a full-color ad for 51, a condo and loft development from Centex Homes (CTX) near downtown San Jose. The web site for the housing development has no pricing information on it that I could find, which is a bit annoying, seeing as the anti-hand-burning jacket actually lured me to the web site. Maybe the prices are changing too fast?"
    • Screaming Values Are Out There (Motley Fool, Nov. 6th): "MGIC Investment (MTG) is expecting negative earnings in 2007 and 2008. Mortgage losses and loss reserves are already three times the five-year average level, and I expect them to go higher during 2008. Oddly enough, the tightening credit crunch actually plays to the company's advantage, since many avoided mortgage insurance (insurance is generally needed when the loan-to-home-value ratio is greater than 80%) by using piggyback (second) mortgages. Second mortgages are the first to go as house prices fall and borrowers default. [Now] lenders will insist on mortgage insurance instead of encouraging piggyback mortgages... MGIC is selling at around half its intrinsic value."
    • HouseValues Reports $900,000 Net Loss In Q3 (Inman News, Nov. 6th): "SEC filing: Online real estate marketing and lead-generation company HouseValues Inc. (SOLD) this week announced a $900,000 net loss for Q3'07, vs. a $500,000 net loss for Q3'06... HouseValues closed its Washington facility and laid off 100 workers, about 30% of its workforce... to reduce operating expenses...HouseValues [also] acquired Realty Generator LLC, a technology company that offers lead-generation services to real estate brokerage companies, and a related company, Blackwater Realty LLC, on Nov. 1... HouseValues: "Agents reduced their investments in marketing as transaction volumes continued to slow in many major markets." The company acquired 250,000 shares of its common stock during Q3'06."

    Commercial Real Estate and Real Estate Investment Trusts (REITs)

    • Financial Ground Has Shifted Under a Record Deal (NY Times, Nov. 7th): "Robert M. White Jr., president, Real Capital Analytics: Kushner Companies $1.8 billion purchase of 666 Fifth Avenue in January commanded the highest price ever paid for a single building... [but] the financing raised eyebrows: A Barclays-led group of lenders... provided an interest-only first mortgage of $1.215B based on an annual cash flow of $114 million, or 1.5 times the debt service, according to SEC documents. But... the cash flow from existing rents would actually cover only 0.65% of the debt service. Robert White: The building’s shortfall amounts to $5M a month. A $100M reserve fund was included in the debt package to cover the shortfall."
    • Times Square Comfort Inn Sells for $31M (The Real Deal, Nov. 6th): "The Times Square Comfort Inn has sold to Gemini Real Estate Advisors for $31.7 million. The 78-room hotel at 42 West 35th Street, between Fifth and Sixth avenues, is near the new New York Times building. Hotels are booming in Times Square."
    • Special Report: Real Estate's Biggest Deals (Daily Business Review, Nov. 5th): "Commercial real estate lenders in South Florida... are demanding more cash at closings and expecting healthy cash flow on commercial properties, leaving it to deep-pocket pension funds, hedge funds and institutional investors to seal most of the big deals... Gone are the days when investors would use bridge loans and interest-only 10-year loans for their office, warehouse and shopping center purchases with little money down... Lenders now want 25%-35% equity to finance a deal, brokers say... University of California economist Kenneth Rosen: REITs are expected to plummet about 20% in the next year... [they] are overvalued by 25%-40% relative to stocks and bonds."

    Two Reasons To Buy Sallie Mae Before Everybody Else Does

    Two reasons to buy Sallie Mae ((SLM) $42.86):

    First, the odds on your money are pretty good here in the low forties $42.86; Stop loss at 40.50, and upside as much as 15% to 20% through next July. You may get it a dollar or two cheaper, but don’t wait since the short covering rally in financials has begun in earnest, and all boats will be lifted once Citigroup ((C): $35.00) makes a definitive bottom this week (see my post on short covering in financials from Tuesday).

    Second, the chance that a bid for the company will be resuscitated would make purchasing this stock worthwhile, even if the deal was priced well below the original offer.

    Sallie Mae, a favorite short of mine (2003 through 2005) seems like a low risk call option, with downside protection in the way of a multi-year low, and plenty of support provided by the two factors mentioned above. Of course, you could always pair this long with a short on First Marblehead ((FMD): $34.99), which offers little upside (lot of stock overhang up here), and, from my perch, a stock worth something in the ballpark of mid to low 20's.

    Current Dollar Decline Longer, More Severe Than Historical Declines

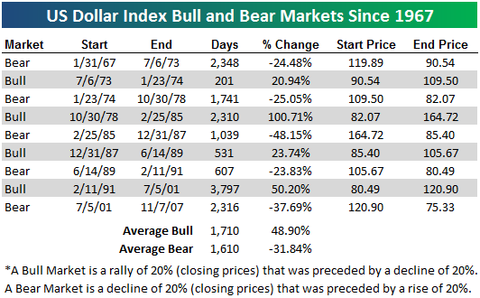
    With the US Dollar index falling even lower today, below we highlight the historical bull and bear markets of the currency.

    As shown, market cycles for the currency are longer than some of the other asset classes that we have looked at. The average bull market for the US Dollar is 1,710 days long for an average gain of 48.90%. The average bear market is 1,610 days for an average decline of 31.84%.

    Based on these averages, the current bear market is both longer in duration and more extreme in its decline. Since the current bear market in the US Dollar started in July 2001, currency has declined 37.69%.

    click to enlarge

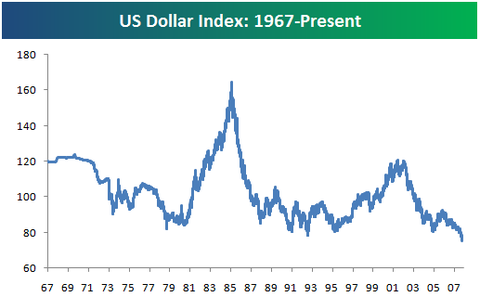
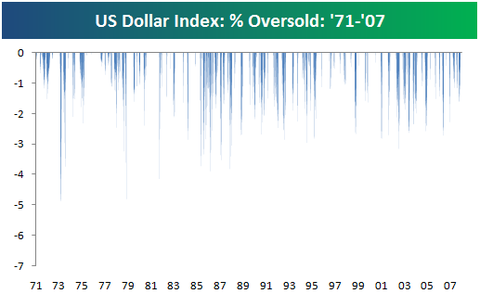
    Below we highlight a historical price chart of the US Dollar index. As shown, we're currently at record lows. However, the currency isn't nearly as oversold as it has been in the past based on its distance from its 50-day moving average. Currently, the US Dollar is 2.25% below the bottom of it trading range.

    As highlighted in the second chart below, the Dollar has reached oversold levels of 3% to 4% quite frequently.

    Comparing Bubbles: China vs. Nasdaq and Homebuilders


    On Monday we compared the rises and crashes of the Nasdaq and the Homebuilders during their respective bubbles. A Bespoke reader asked if we could overlay the current rise in China's Shanghai Composite on the chart to see where its bull run currently stands in comparison.

    The Nasdaq and Homebuilders rallied for around 2,000 calendar days, while the Shanghai has currently only been in rally mode for 560 days. However, the gains in China of 488% are fast approaching the max gains that the Nasdaq saw of 639% at its peak.

    The most interesting data points here are the starting dates of the bubbles. The Homebuilders began their enormous rise on March 14, 2000, just four days after the Nasdaq peaked. Interestingly, the Shanghai started its meteoric rise on July 11, 2005 -- just nine days before the Homebuilders peaked. Investors have seemingly flocked from one bubble to the next.